Volume 27, Number 10—October 2021
Research
Severe Acute Respiratory Syndrome Coronavirus 2 Transmission in Georgia, USA, February 1–July 13, 2020
Yuke Wang , Casey Siesel, Yangping Chen, Ben Lopman, Laura Edison, Michael Thomas, Carly Adams, Max Lau, and Peter F.M. Teunis
Figure 3
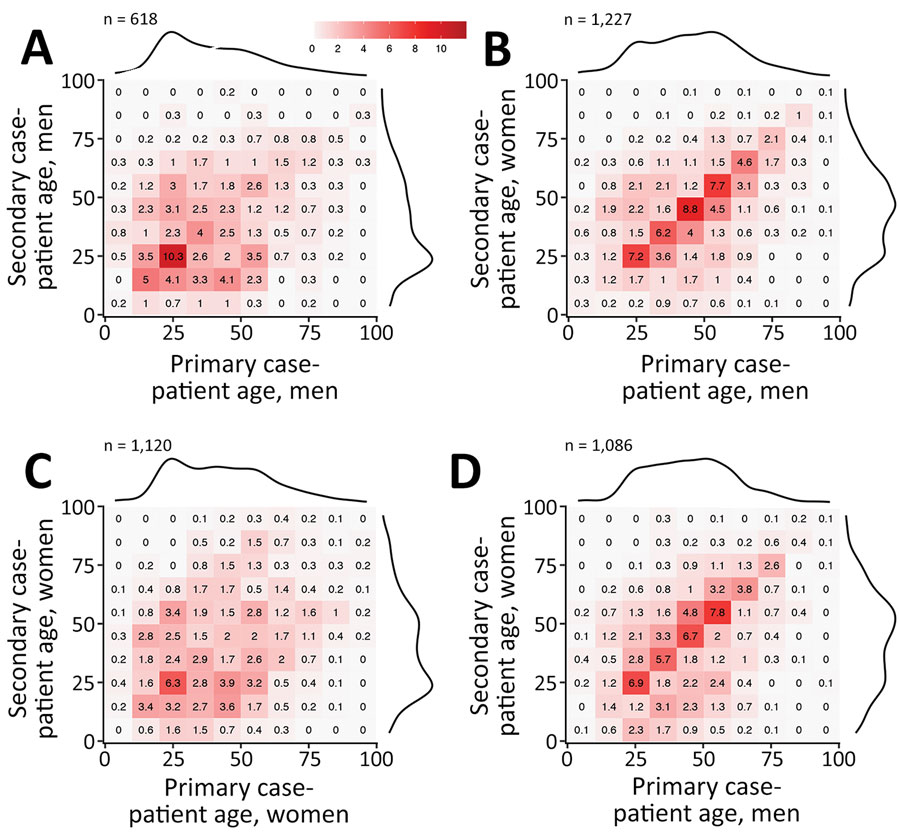
Figure 3. Patterns of severe acute respiratory syndrome coronavirus 2 transmission according to patient sex and age, based on 4,080 tracked pairs of coronavirus disease cases in Georgia, USA, February–July 2020. A) Male-to-male transmission; B) male-to-female transmission; C) female-to-female transmission; D) female-to-male transmission. The matrix graphs show numbers of transmission pairs as a percentage of the total, with primary case-patients as columns and their secondary case-patients as rows. Darker colors indicate a higher percentage of fraction of tracked pairs observed. Marginal totals are shown as density curves to illustrate the age distribution of case-patients.
Page created: July 30, 2021
Page updated: September 19, 2021
Page reviewed: September 19, 2021
The conclusions, findings, and opinions expressed by authors contributing to this journal do not necessarily reflect the official position of the U.S. Department of Health and Human Services, the Public Health Service, the Centers for Disease Control and Prevention, or the authors' affiliated institutions. Use of trade names is for identification only and does not imply endorsement by any of the groups named above.