Volume 27, Number 10—October 2021
Research
Severe Acute Respiratory Syndrome Coronavirus 2 Transmission in Georgia, USA, February 1–July 13, 2020
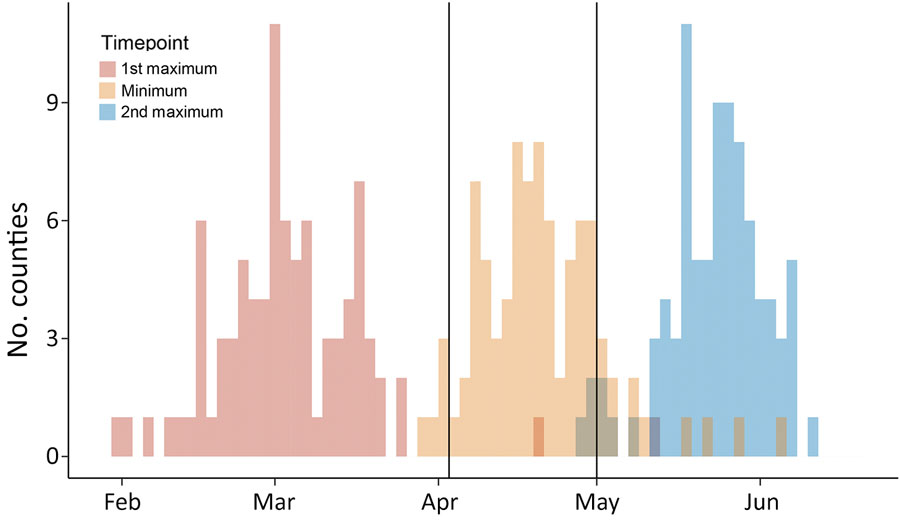
Figure 7

Figure 7. Distributions of estimated dates of first maximum, minimum, and second maximum in effective reproduction numbers for severe acute respiratory syndrome coronavirus 2 transmission in 87 counties in Georgia, USA, with 200 cumulative cases by July 13, 2020, and dates of key events possibly driving virus transmission.
Page created: July 30, 2021
Page updated: September 19, 2021
Page reviewed: September 19, 2021
The conclusions, findings, and opinions expressed by authors contributing to this journal do not necessarily reflect the official position of the U.S. Department of Health and Human Services, the Public Health Service, the Centers for Disease Control and Prevention, or the authors' affiliated institutions. Use of trade names is for identification only and does not imply endorsement by any of the groups named above.