Volume 27, Number 11—November 2021
Dispatch
Correlation of SARS-CoV-2 Subgenomic RNA with Antigen Detection in Nasal Midturbinate Swab Specimens
Katherine Immergluck1, Mark D. Gonzalez, Jennifer K. Frediani, Joshua M. Levy, Janet Figueroa, Anna Wood, Beverly B. Rogers, Jared O’Neal, Roger Elias-Marcellin, Allie Suessmith, Julie Sullivan, Raymond F. Schinazi, Ahmed Babiker, Anne Piantadosi, Miriam B. Vos, Greg S. Martin, Wilbur A. Lam, and Jesse J. Waggoner
Figure 1
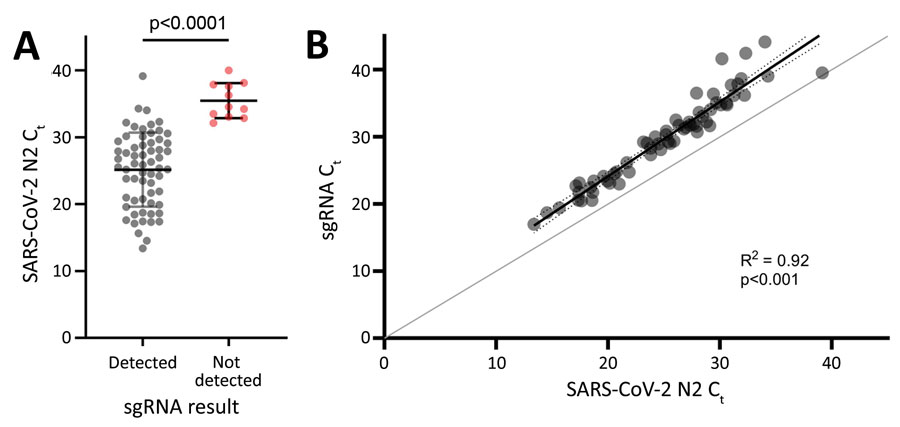
Figure 1. Correlation of sgRNA levels with total SARS-CoV-2 RNA in samples from study participants in Atlanta, Georgia, USA. A) N2 Ct values for samples in which sgRNA was detectable (gray dots) or not detectable (red dots). Horizontal bars indicate means, and error bars indicate SDs. B) sgRNA Ct values versus corresponding Ct values for the N2 target. Results of simple linear regression (black line) and error bars (dotted lines) are shown. Line of identity (gray line) is shown for reference. Ct, cycle threshold; N2, nucleocapsid 2; SARS-CoV-2, severe acute respiratory syndrome coronavirus 2; sgRNA, subgenomic RNA.
1Current affiliation: Pomona College, Claremont, California, USA.
Page created: August 18, 2021
Page updated: October 19, 2021
Page reviewed: October 19, 2021
The conclusions, findings, and opinions expressed by authors contributing to this journal do not necessarily reflect the official position of the U.S. Department of Health and Human Services, the Public Health Service, the Centers for Disease Control and Prevention, or the authors' affiliated institutions. Use of trade names is for identification only and does not imply endorsement by any of the groups named above.