Volume 27, Number 12—December 2021
Dispatch
Detection of SARS-CoV-2 in Wastewater at Residential College, Maine, USA, August–November 2020
Figure
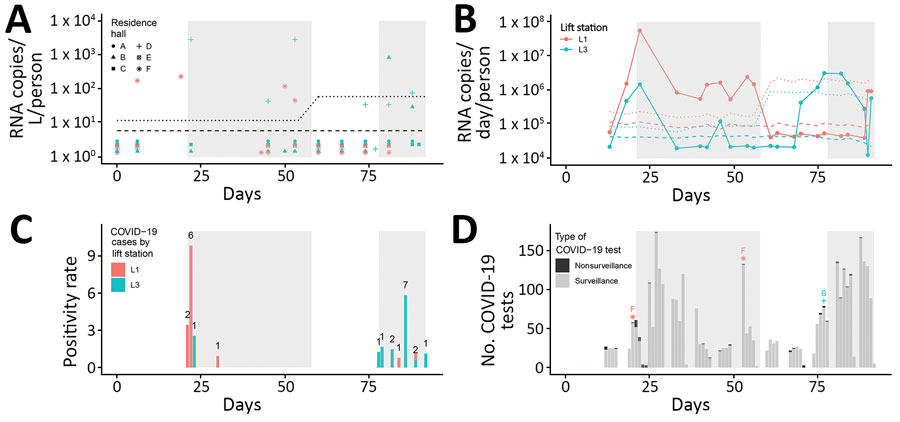
Figure. Detection of severe acute respiratory syndrome coronavirus 2 (SARS-CoV-2) RNA in wastewater samples at a residential college, Maine, USA, August–November 2020. A) Grab samples from 6 residence halls (i.e., A–F). B) 24-hour composite samples from 2 lift stations: L1 for halls E–F and L3 for halls A–D. Dashed lines indicate theoretical limit of detection; dotted lines indicate limit of quantification. These limits were dependent on flow rate (B only) and population served for each sample. Data points below dashed lines indicate undetected concentrations of SARS-CoV-2 RNA and are recorded at one-half the limit of quantification (5). Data points between dashed and dotted lines indicates detectable but nonquantifiable concentrations of SARS-CoV-2 RNA and are recorded at one half the limit of quantification. C) Daily positivity rate of COVID-19 tests. The number above the bar indicates the number of positive cases. Positive results were typically received within 24 hours after administration of the diagnostic test. D) Total COVID-19 diagnostic tests, including surveillance and nonsurveillance tests. Letter and symbol indicate resident hall of affected student. Shaded areas indicate the days during which the college declared an active outbreak. COVID-19, coronavirus disease.
References
- Ahmed W, Angel N, Edson J, Bibby K, Bivins A, O’Brien JW, et al. First confirmed detection of SARS-CoV-2 in untreated wastewater in Australia: A proof of concept for the wastewater surveillance of COVID-19 in the community. Sci Total Environ. 2020;728:
138764 . DOIPubMedGoogle Scholar - Weidhaas J, Aanderud ZT, Roper DK, VanDerslice J, Gaddis EB, Ostermiller J, et al. Correlation of SARS-CoV-2 RNA in wastewater with COVID-19 disease burden in sewersheds. Sci Total Environ. 2021;775:
145790 . DOIPubMedGoogle Scholar - Gibas C, Lambirth K, Mittal N, Juel MAI, Barua VB, Roppolo Brazell L, et al. Implementing building-level SARS-CoV-2 wastewater surveillance on a university campus. Sci Total Environ. 2021;782:
146749 . DOIPubMedGoogle Scholar - Scott LC, Aubee A, Babahaji L, Vigil K, Tims S, Aw TG. Targeted wastewater surveillance of SARS-CoV-2 on a university campus for COVID-19 outbreak detection and mitigation. Environ Res. 2021;200:
111374 . DOIPubMedGoogle Scholar - Centers for Disease Control and Prevention. Wastewater surveillance data reporting and analytics. 2021 [cited 2020 Sep 5]. https://www.cdc.gov/healthywater/surveillance/wastewater-surveillance/data-reporting-analytics.html
- Centers for Disease Control and Prevention. Ending home isolation for persons with COVID-19 not in healthcare settings. 2021 [cited 2020 Sep 20]. https://www.cdc.gov/coronavirus/2019-ncov/hcp/disposition-in-home-patients.html
- Centers for Disease Control and Prevention. If you are sick or caring for someone. 2020 [cited 2020 Sep 20]. https://www.cdc.gov/coronavirus/2019-ncov/if-you-are-sick/index.html
- Wölfel R, Corman VM, Guggemos W, Seilmaier M, Zange S, Müller MA, et al. Virological assessment of hospitalized patients with COVID-2019. Nature. 2020;581:465–9. DOIPubMedGoogle Scholar
- Wang X, Zheng J, Guo L, Yao H, Wang L, Xia X, et al. Fecal viral shedding in COVID-19 patients: Clinical significance, viral load dynamics and survival analysis. Virus Res. 2020;289:
198147 . DOIPubMedGoogle Scholar - Betancourt WQ, Schmitz BW, Innes GK, Prasek SM, Pogreba Brown KM, Stark ER, et al. COVID-19 containment on a college campus via wastewater-based epidemiology, targeted clinical testing and an intervention. Sci Total Environ. 2021;779:
146408 . DOIPubMedGoogle Scholar
1Current affiliation: St. Catherine University, St. Paul, Minnesota, USA.