Volume 27, Number 2—February 2021
Research
Excess Deaths during Influenza and Coronavirus Disease and Infection-Fatality Rate for Severe Acute Respiratory Syndrome Coronavirus 2, the Netherlands
Liselotte van Asten , Carel N. Harmsen, Lenny Stoeldraijer, Don Klinkenberg, Anne C. Teirlinck, Marit M.A. de Lange, Adam Meijer, Jan van de Kassteele, Arianne B. van Gageldonk-Lafeber, Susan van den Hof, and Wim van der Hoek
Figure 3
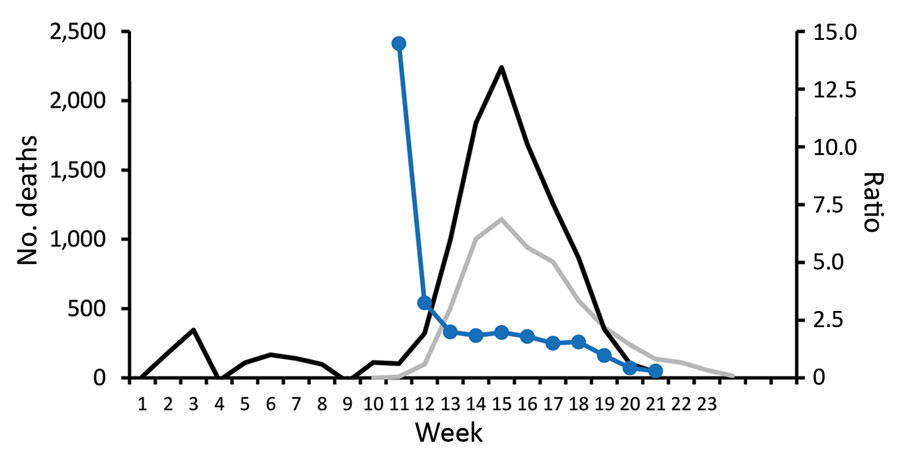
Figure 3. Excess deaths during influenza and coronavirus disease (COVID-19) and infection-fatality rate for severe acute respiratory syndrome coronavirus 2, the Netherlands. Excess deaths, reported COVID-19 deaths, and ratio between the 2 items (weeks 1–25, 2020). Black lines indicates excess deaths, gray line indicates COVID-19 reported deaths, and blue line indicates the ratio. Excess deaths were estimated with deaths reported within 3 weeks (and thus not yet available for week 24–25). The ratio for week 11 was 14.5, during the second (and final) week of the mixed influenza and COVID-19 epidemic.
Page created: November 16, 2020
Page updated: January 23, 2021
Page reviewed: January 23, 2021
The conclusions, findings, and opinions expressed by authors contributing to this journal do not necessarily reflect the official position of the U.S. Department of Health and Human Services, the Public Health Service, the Centers for Disease Control and Prevention, or the authors' affiliated institutions. Use of trade names is for identification only and does not imply endorsement by any of the groups named above.