Early Transmission Dynamics, Spread, and Genomic Characterization of SARS-CoV-2 in Panama
Danilo Franco
1, Claudia Gonzalez
1, Leyda E. Abrego
1, Jean-Paul Carrera, Yamilka Diaz, Yaset Caicedo, Ambar Moreno, Oris Chavarria, Jessica Gondola, Marlene Castillo, Elimelec Valdespino, Melissa Gaitán, Jose Martínez-Mandiche, Lizbeth Hayer, Pablo Gonzalez, Carmen Lange, Yadira Molto, Dalis Mojica, Ruben Ramos, Maria Mastelari, Lizbeth Cerezo, Lourdes Moreno, Christl A. Donnelly, Juan Miguel Pascale, Nuno Rodrigues Faria, Sandra Lopez-Verges

, Alexander A. Martinez, and
on behalf of Gorgas COVID19 team and Panama COVID19 Laboratory Network 3 -->
Author affiliations: Gorgas Memorial Institute of Health Studies, Panama City, Panama (D. Franco, C. Gonzalez, L.E. Abrego, J.-P. Carrera, Y. Diaz, A. Moreno, O. Chavarria, J. Gondola, M. Castillo, E. Valdespino, M. Gaitán, J. Martínez-Mandiche, D. Mojica, R. Ramos, J.M. Pascale, S. Lopez-Verges, A.A. Martinez); Universidad de Panama, Panama City (D. Franco, C. Gonzalez, L.E. Abrego, J.M. Pascale, S. Lopez-Verges, A.A. Martinez); Ministry of Health of Panama, Panama City (L. Hayer, P. Gonzalez, C. Lange, Y. Molto, M. Mastelari, L. Cerezo, L. Moreno); University of Oxford, Oxford, UK (J.-P. Carrera, C.A. Donnelly, N.R. Faria); Fundación Valle del Lili, Cali, Colombia (Y. Caicedo); Imperial College, London, UK (C.A. Donnelly, N.R. Faria)
Main Article
Figure 1
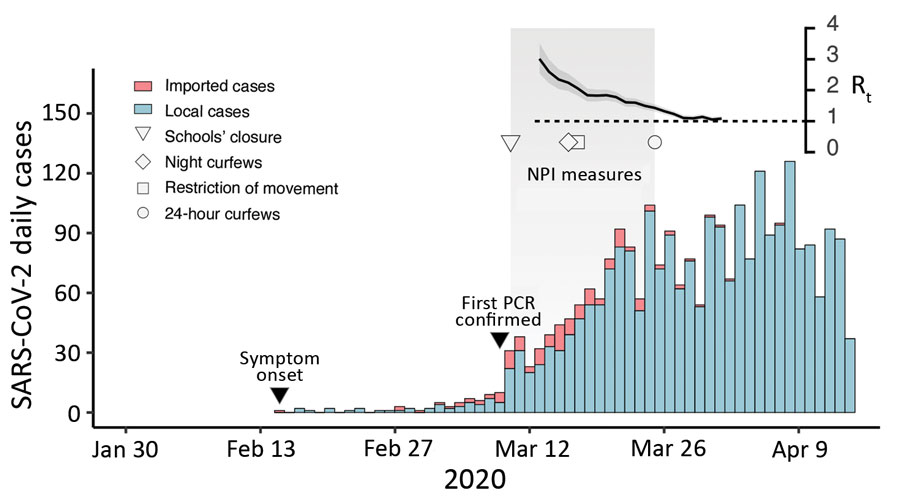
Figure 1. Epidemic curve of SARS-CoV-2 cases in Panama showing daily incidence of confirmed imported and local infections detected through April 16, 2020, with symptom onset during February 15–April 13, 2020. Gray shaded area indicates time period during which nonpharmaceutical interventions measures were initiated. Inset at top right shows the time-varying effective reproduction number (Rt) for a time frame of 45 days (x-axis); dark gray shading indicates 95% CI, and dashed line indicates threshold value Rt = 1. SARS-CoV-2, severe acute respiratory syndrome coronavirus 2.
Main Article
Page created: November 09, 2020
Page updated: January 23, 2021
Page reviewed: January 23, 2021
The conclusions, findings, and opinions expressed by authors contributing to this journal do not necessarily reflect the official position of the U.S. Department of Health and Human Services, the Public Health Service, the Centers for Disease Control and Prevention, or the authors' affiliated institutions. Use of trade names is for identification only and does not imply endorsement by any of the groups named above.