Epidemiology and Clinical Course of First Wave Coronavirus Disease Cases, Faroe Islands
Marnar F. Kristiansen

, Bodil H. Heimustovu, Sanna á Borg, Tróndur Høgnason Mohr, Hannes Gislason, Lars Fodgaard Møller, Debes H. Christiansen, Bjarni á Steig, Maria Skaalum Petersen, Marin Strøm, and Shahin Gaini
Author affiliations: National Hospital of the Faroe Islands, Tórshavn, Faroe Islands (M.F. Kristiansen, B.H. Heimustovu, S. á Borg, T.H. Mohr, B. á Steig, S. Gaini); Ministry of Health COVID-19 Task Force, Tórshavn (M.F. Kristiansen, B.H. Heimustovu, B. á Steig); University of the Faroe Islands, Tórshavn (M.F. Kristiansen, H. Gislason, M.S. Petersen, M. Strøm, S. Gaini); Office of the Chief Medical Officer, Tórshavn (L.F. Møller); Faroese Food and Veterinary Authority, Tórshavn (D.H. Christiansen); The Faroese Hospital System, Tórshavn (M.S. Petersen); Statens Serum Institut, Copenhagen, Denmark (M. Strøm); Odense University Hospital, Odense, Denmark (S. Gaini); University of Southern Denmark, Odense (S. Gaini)
Main Article
Figure 4
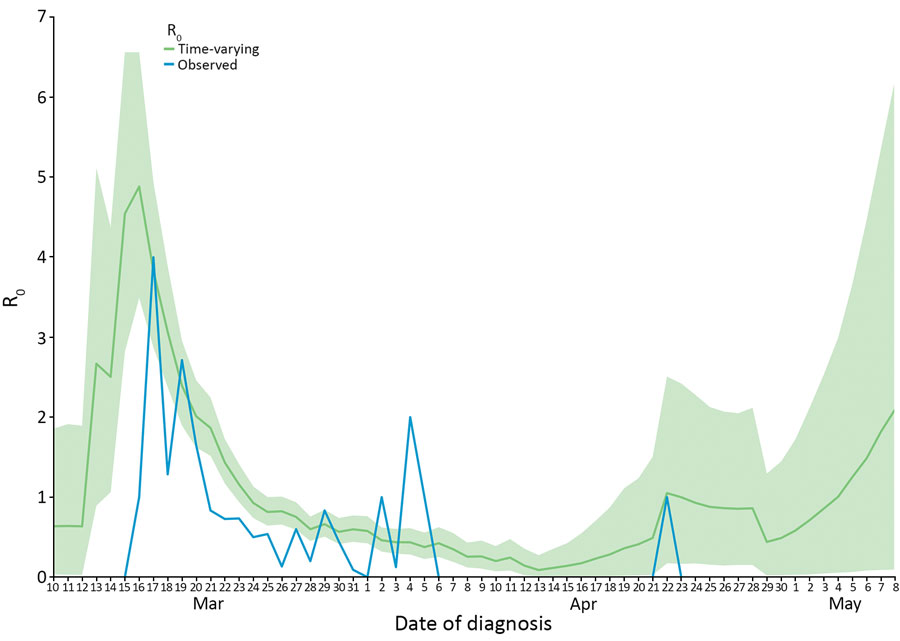
Figure 4. Time-varying reproduction number (Rt) and observed reproduction number (Robs) for coronavirus disease by date, Faroe Islands. Green shading indicates 95% CI for Rt. We noted a rapid decrease in Rt, from 4.88 on March 16. From March 24 onward, Rt and Robs were <1 until April 22 when the last case was confirmed in the Faroe Islands. After May 4, Rt rose >1 due to increasing uncertainty in the estimate. We calculated Rt by using the EpiEstim package in R (R Foundation for Statistical Computing, https://www.r-project.org) and local data on serial interval and imported cases. Robs was determined by information from the transmission chains. We made 2 adjustments to compare Robs to Rt: we moved Robs 5 days forward (equal to the serial interval) because Robs is measured on the infector; and we set Rt on the infected case. When the infector was unknown, we set transmission as 5 days earlier, equal to the serial interval, to avoid underestimating Robs by censoring those cases. R0, reproduction number; Robs, observed reproduction number; Rt, time-varying reproduction number.
Main Article
Page created: January 07, 2021
Page updated: February 21, 2021
Page reviewed: February 21, 2021
The conclusions, findings, and opinions expressed by authors contributing to this journal do not necessarily reflect the official position of the U.S. Department of Health and Human Services, the Public Health Service, the Centers for Disease Control and Prevention, or the authors' affiliated institutions. Use of trade names is for identification only and does not imply endorsement by any of the groups named above.