Skip directly to site content Skip directly to page options Skip directly to A-Z link Skip directly to A-Z link Skip directly to A-Z link
Volume 27, Number 3—March 2021
Research

Daily Forecasting of Regional Epidemics of Coronavirus Disease with Bayesian Uncertainty Quantification, United States

Yen Ting LinComments to Author , Jacob Neumann, Ely F. Miller, Richard G. Posner, Abhishek Mallela, Cosmin Safta, Jaideep Ray, Gautam Thakur, Supriya Chinthavali, and William S. Hlavacek
Author affiliations: Los Alamos National Laboratory, Los Alamos, New Mexico, USA (Y.T. Lin, W.S. Hlavacek); Northern Arizona University, Flagstaff, Arizona, USA (J. Neumann, E.F. Miller, R.G. Posner); University of California, Davis, California, USA (A. Mallela); Sandia National Laboratories, Livermore, California, USA (C. Safta, J. Ray); Oak Ridge National Laboratory, Oak Ridge, Tennessee, USA (G. Thakur, S. Chinthavali)

Main Article

Figure 2

Temporal correlations of fractional case counts of coronavirus disease in and around the New York City, New York, metropolitan statistical area, United States, March 1–June 13, 2020. The fractional case count for a county on a given date is defined as the reported number of cases on that date divided by the total reported number of cases in the county over the entire time period of interest. Panels show the fractional cast counts for: A) the 23 counties comprising the New York City metropolitan statistical area (Fano factor 0.0026); B) the 62 counties comprising New York state (Fano factor 0.021); C) the 21 counties comprising New Jersey (Fano factor 1.2); and D) the 67 counties comprising Pennsylvania (Fano factor 0.028). Within each plot, different colors indicate the data points from each distinct county. Purple–yellow gradient indicates alphabetical order of the counties. A smaller Fano factor indicates less county-to-county variability.

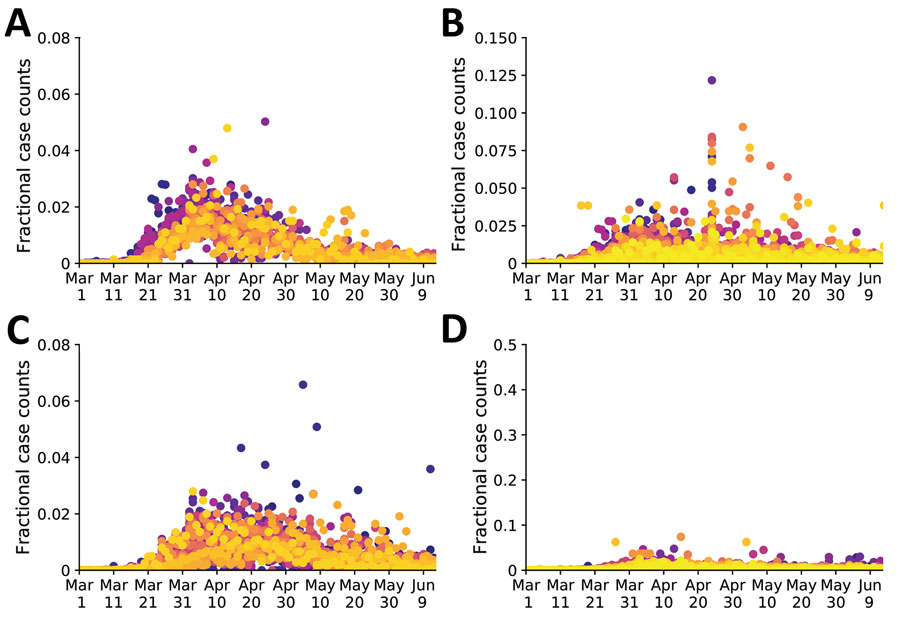
Figure 2. Temporal correlations of fractional case counts of coronavirus disease in and around the New York City, New York, metropolitan statistical area, United States, March 1–June 13, 2020. The fractional case count for a county on a given date is defined as the reported number of cases on that date divided by the total reported number of cases in the county over the entire time period of interest. Panels show the fractional cast counts for: A) the 23 counties comprising the New York City metropolitan statistical area (Fano factor 0.0026); B) the 62 counties comprising New York state (Fano factor 0.021); C) the 21 counties comprising New Jersey (Fano factor 1.2); and D) the 67 counties comprising Pennsylvania (Fano factor 0.028). Within each plot, different colors indicate the data points from each distinct county. Purple–yellow gradient indicates alphabetical order of the counties. A smaller Fano factor indicates less county-to-county variability.

Main Article

Page created: January 20, 2021
Page updated: February 21, 2021
Page reviewed: February 21, 2021
The conclusions, findings, and opinions expressed by authors contributing to this journal do not necessarily reflect the official position of the U.S. Department of Health and Human Services, the Public Health Service, the Centers for Disease Control and Prevention, or the authors' affiliated institutions. Use of trade names is for identification only and does not imply endorsement by any of the groups named above.
file_external