Volume 27, Number 3—March 2021
Research
Daily Forecasting of Regional Epidemics of Coronavirus Disease with Bayesian Uncertainty Quantification, United States
Yen Ting Lin , Jacob Neumann, Ely F. Miller, Richard G. Posner, Abhishek Mallela, Cosmin Safta, Jaideep Ray, Gautam Thakur, Supriya Chinthavali, and William S. Hlavacek
Figure 6
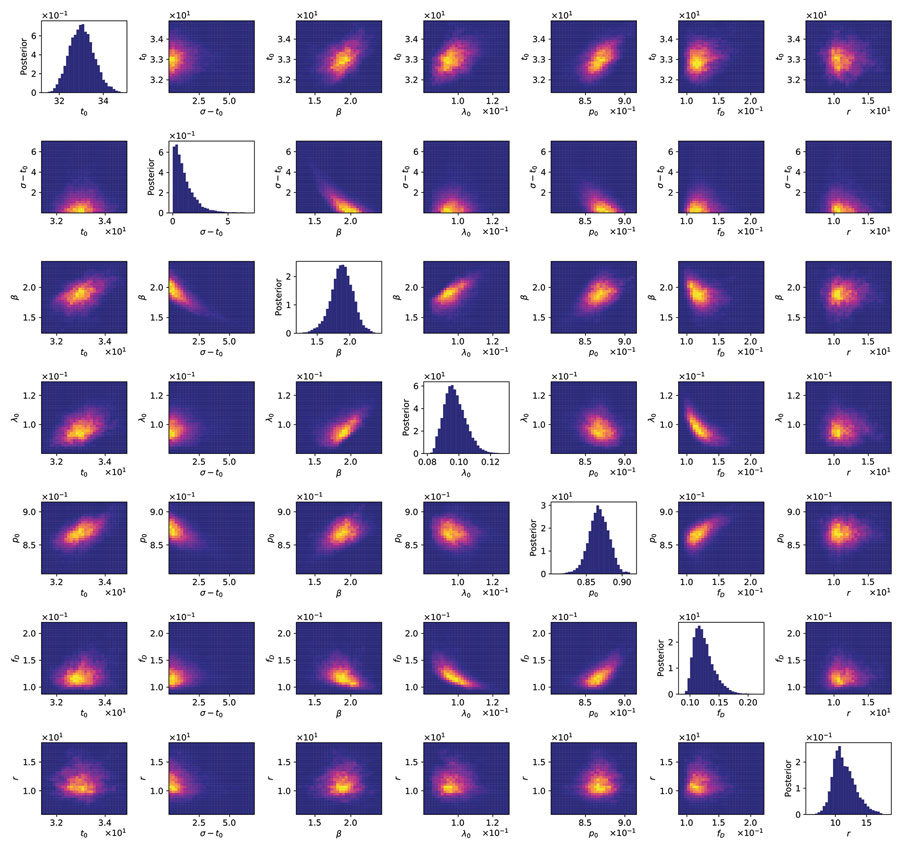
Figure 6. Matrix of 1- and 2-dimensional projections of the 7-dimensional posterior samples obtained for the adjustable parameters associated with the compartmental model (n = 0) for daily new case counts of coronavirus disease in the New York City, New York, metropolitan statistical area, United States, January 21–June 21, 2020. Plots of marginal posteriors (1-dimensional projections) are shown on the diagonal from top left to bottom right. Other plots are 2-dimensional projections indicating the correlations between parameter estimates. Brightness indicates higher probability density. A compact bright area indicates absence of or relatively low correlation. An extended, asymmetric bright area indicates relatively high correlation.
Page created: January 20, 2021
Page updated: February 21, 2021
Page reviewed: February 21, 2021
The conclusions, findings, and opinions expressed by authors contributing to this journal do not necessarily reflect the official position of the U.S. Department of Health and Human Services, the Public Health Service, the Centers for Disease Control and Prevention, or the authors' affiliated institutions. Use of trade names is for identification only and does not imply endorsement by any of the groups named above.