Volume 27, Number 3—March 2021
Research
Decline of Tuberculosis Burden in Vietnam Measured by Consecutive National Surveys, 2007–2017
Hai Viet Nguyen, Hoa Binh Nguyen , Nhung Viet Nguyen, Frank Cobelens, Alyssa Finlay, Cu Huy Dao, Veriko Mirtskhulava, Philippe Glaziou, Huyen T.T. Pham, Petra de Haas, and Edine Tiemersma
Figure 2
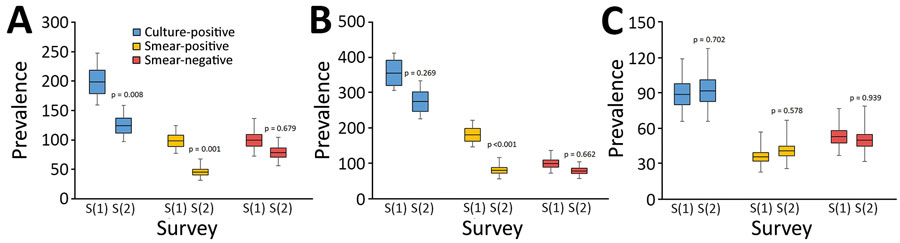
Figure 2. Comparison of the prevalence (cases/100,000 adults) of culture-positive TB, smear-positive TB and smear-negative TB between the first and second national TB prevalence surveys in Vietnam, 2007 and 2017. (A) Overall prevalence; (B) prevalence among male participants; (C) prevalence among female participants. Box tops and bottoms indicate the standard errors of the prevalence; horizontal lines within boxes indicate the point estimates of the prevalence; error bars indicate 95% CIs. S(1), first TB prevalence survey (2007); S(2), second TB prevalence survey (2017).
Page created: January 11, 2021
Page updated: February 21, 2021
Page reviewed: February 21, 2021
The conclusions, findings, and opinions expressed by authors contributing to this journal do not necessarily reflect the official position of the U.S. Department of Health and Human Services, the Public Health Service, the Centers for Disease Control and Prevention, or the authors' affiliated institutions. Use of trade names is for identification only and does not imply endorsement by any of the groups named above.