Volume 27, Number 5—May 2021
Perspective
Coordinated Strategy for a Model-Based Decision Support Tool for Coronavirus Disease, Utah, USA
Hannah R. Meredith, Emerson Arehart1, Kyra H. Grantz1, Alexander Beams, Theresa Sheets, Richard Nelson, Yue Zhang, Russell G. Vinik, Darryl Barfuss, Jacob C. Pettit, Keegan McCaffrey, Angela C. Dunn, Michael Good, Shannon Frattaroli, Matthew H. Samore, Justin Lessler, Elizabeth C. Lee, and Lindsay T. Keegan
Figure 3
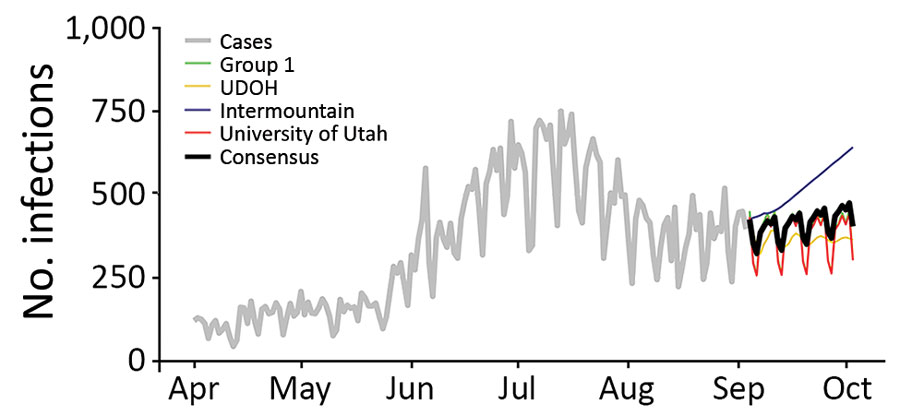
Figure 3. Example of a consensus model figure from a decision support tool for coronavirus disease, Utah, USA. Model results compare the number of new reported infections (daily) across the 4 modeling groups presented to Utah stakeholders on September 9, 2020. Light gray line represents reported infections, black line represents the consensus model (i.e., the average of the 4 individual group models), green line represents the results from modeling group 1, yellow line represents the results from the UDOH, blue line represents the results from the Intermountain Healthcare model, and red line represents the results from the University of Utah model. UDOH, Utah Department of Health.
1These authors contributed equally to this article.
Page created: March 26, 2021
Page updated: April 20, 2021
Page reviewed: April 20, 2021
The conclusions, findings, and opinions expressed by authors contributing to this journal do not necessarily reflect the official position of the U.S. Department of Health and Human Services, the Public Health Service, the Centers for Disease Control and Prevention, or the authors' affiliated institutions. Use of trade names is for identification only and does not imply endorsement by any of the groups named above.