Volume 27, Number 5—May 2021
Research Letter
Temporal Variations in Respiratory Syncytial Virus Epidemics, by Virus Subtype, 4 Countries
Abstract
Temporal variation of respiratory syncytial virus (RSV) epidemics was recently reported to be determined by the dominant RSV subtype. However, when we repeated the analysis for 4 countries in the Northern and Southern Hemispheres, the dominant subtype did not seem to affect temporal variation of RSV epidemics.
Respiratory syncytial virus (RSV) is responsible for most acute lower respiratory tract infections in young children worldwide (1) and accounts for a substantial burden among older adults (2). Although it is generally accepted that RSV epidemics in temperate climates occur in winter, some temporal variation of epidemics remains unexplained (3).
Recently, Yu et al. conducted a study among children (<13 years of age) with pneumonia at the Beijing Children’s Hospital (Beijing, China) during July 2007–June 2015 and reported that temporal variation is partly explained by seasonal differences in virus subtype dominance (4). To define the timing of RSV seasonality, they used a regression model and 10% threshold method previously described (3). They found that onset and peak of seasons occurred ≈3–5 weeks earlier and that duration was ≈6 weeks longer when RSV subtype A (RSV-A) was dominant than when subtype B (RSV-B) was dominant. These results, if generalizable, would have major implications for the epidemiology of RSV surveillance programs and healthcare planning.
We examined whether similar patterns in the dominant RSV subtype and timing of RSV epidemics were found in the Northern and Southern Hemispheres by using a large dataset from the Global Epidemiology of RSV in the Community and Hospitalised Care study (https://www.nivel.nl/en/geri). We included in our analysis only countries with a temperate climate. For Northern Hemisphere countries, seasons were defined as week 27 through week 26 of the next calendar year; for Southern Hemisphere countries, seasons were defined as week 1 through 52 of the same calendar year. We included seasons if >50 RSV cases with subtyped information available (diagnosed by PCR) had been reported. We included persons of all ages; the Beijing study included only children <13 years of age. In addition, the case definitions for each study did not entirely overlap. In defining the start, duration, and peak of the RSV seasons, we followed a similar approach as Yu et al. (i.e., 10% threshold [4]). We defined the onset week of an epidemic as the first of 2 consecutive weeks in which the percentage of specimens testing positive exceeded 10%. The offset week was determined as the second week of the last 2 consecutive weeks when this threshold was breached (3).
We explored the relationship between the timing of an epidemic and the dominant RSV subtype (>50% of cases) by calculating the mean start, end, and duration of the seasons according to virus subtype. We applied a regression analysis with robust SEs to account for the potential clustering of individual country results.
Figure
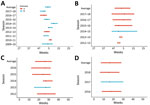
Figure. Temporal variation in respiratory syncytial virus, defined by using 10% positivity threshold, by dominant virus subtype, country, and season. A) The Netherlands; B) Portugal; C) New Zealand; D) South Africa....
We included weekly subtyped RSV data from the Northern (Netherlands and Portugal) and Southern (New Zealand and South Africa) Hemispheres; surveillance systems for those countries are described elsewhere (5–8). We analyzed 24 seasons (5,189 cases), of which RSV-A was dominant for 14 (Table). A dominant RSV-A or RSV-B season was determined by using the 50% cutoff; this percentage was frequently close to 50%. For example, the proportion of persons with an RSV-A–positive test result was 51%–85% (Figure). All differences in timing were not significant; RSV-A–dominant seasons started 2 weeks earlier (p = 0.3), ended 2 weeks earlier (p = 0.3), and peaked 2 weeks earlier (p = 0.2) than RSV-B–dominant seasons. Mean durations were 14.5 weeks for RSV-A–dominant seasons and 14.9 weeks for RSV-B–dominant seasons (p = 0.9).
We found no significant difference in the effect of the dominant RSV subtype on temporal variation of RSV epidemics. We did not find the earlier start and longer duration of RSV-A–dominant seasons described by Yu et al. when we used similar methods for the countries included in our analysis. Although the national datasets and dataset used by Yu et al. differ from those that we used in several ways (e.g., case definition and age categories), we believe that these differences do not preclude conducting temporal comparisons of this type.
One limitation of our analysis and that of Yu et al. is the definition of a dominant season. Small differences in virus subtype distribution potentially have a major effect on the results, especially when case numbers are lower in included seasons. An example is the 2016–17 season in Portugal, when RSV-A prevailed but was responsible for only 142 (51%) cases. That finding was similar to that described by Yu et al. for the 2013–14 season, which experienced an almost equal number of cases caused by RSV-A (n = 35) and RSV-B (n = 33). This limitation substantially reduces conclusions that can be drawn from this type of analysis, and we advocate a more stringent definition of an RSV dominant subtype per season (e.g., >70% threshold) for future analyses, thereby ensuring that differences in subtype distribution are real. We recommend that countries monitor RSV subtypes so that our findings can be validated with more data because a temporal variation in RSV epidemics caused by this subtype would have a major effect on the epidemiology of RSV, surveillance programs, and healthcare planning at the local level.
Ms. Staadegaard is an epidemiologist working at the Netherlands Institute for Health Services Research in the Netherlands. Her main research interests include the epidemiology of infectious diseases, with a current focus on respiratory infections.
Acknowledgments
We thank Anne Teirlinck, Gé Donker, Mariëtte Hooiveld, Janneke Hendriksen, the general practitioners, and the patients who contributed to the virologic part of the national sentinel surveillance for influenza-like illness and acute respiratory infection. We also thank Peter Spreeuwenberg for his statistical advice.
This study was funded by Sanofi Pasteur and AstraZeneca.
L.S., A.M., A.P.R., S.H., C.C., J.S., and S.C. declare no competing interests. J.P. declares that Nivel has received unrestricted research grants from the World Health Organization, Sanofi Pasteur, and the Foundation for Influenza Epidemiology. C.D. is an employee of Sanofi Pasteur and may hold shares or stock options in the company.
References
- Shi T, McAllister DA, O’Brien KL, Simoes EAF, Madhi SA, Gessner BD, et al.; RSV Global Epidemiology Network. Global, regional, and national disease burden estimates of acute lower respiratory infections due to respiratory syncytial virus in young children in 2015: a systematic review and modelling study. Lancet. 2017;390:946–58. DOIPubMedGoogle Scholar
- Shi T, Denouel A, Tietjen AK, Campbell I, Moran E, Li X, et al.; RESCEU Investigators. Global disease burden estimates of respiratory syncytial virus–associated acute respiratory infection in older adults in 2015: a systematic review and meta-analysis. J Infect Dis. 2020;222(Suppl 7):S577–83. DOIPubMedGoogle Scholar
- Haynes AK, Prill MM, Iwane MK, Gerber SI; Centers for Disease Control and Prevention (CDC). Respiratory syncytial virus—United States, July 2012-June 2014. MMWR Morb Mortal Wkly Rep. 2014;63:1133–6.PubMedGoogle Scholar
- Yu J, Liu C, Xiao Y, Xiang Z, Zhou H, Chen L, et al. Respiratory syncytial virus seasonality, Beijing, China, 2007–2015. Emerg Infect Dis. 2019;25:1127–35. DOIPubMedGoogle Scholar
- Vos LM, Teirlinck AC, Lozano JE, Vega T, Donker GA, Hoepelman AI, et al. Use of the moving epidemic method (MEM) to assess national surveillance data for respiratory syncytial virus (RSV) in the Netherlands, 2005 to 2017. Euro Surveill. 2019;24:24. DOIPubMedGoogle Scholar
- Sáez-López E, Pechirra P, Costa I, Cristóvão P, Conde P, Machado A, et al. Performance of surveillance case definitions for respiratory syncytial virus infections through the sentinel influenza surveillance system, Portugal, 2010 to 2018. Euro Surveill. 2019;24:24. DOIPubMedGoogle Scholar
- Prasad N, Newbern EC, Trenholme AA, Wood T, Thompson MG, Aminisani N, et al. Respiratory syncytial virus hospitalisations among young children: a data linkage study. Epidemiol Infect. 2019;147:
e246 . DOIPubMedGoogle Scholar - Rha B, Dahl RM, Moyes J, Binder AM, Tempia S, Walaza S, et al. Performance of surveillance case definitions in detecting respiratory syncytial virus infection among young children hospitalized with severe respiratory illness-South Africa, 2009-2014. J Pediatric Infect Dis Soc. 2019;8:325–33. DOIPubMedGoogle Scholar
Figure
Table
Cite This ArticleOriginal Publication Date: April 15, 2021
Table of Contents – Volume 27, Number 5—May 2021
| EID Search Options |
|---|
|
|
|
|
|
|
Please use the form below to submit correspondence to the authors or contact them at the following address:
Lisa Staadegaard, Nivel, Otterstraat 118, 3513 CR Utrecht, the Netherlands
Top