Volume 27, Number 6—June 2021
Dispatch
Epidemiologic Evidence for Airborne Transmission of SARS-CoV-2 during Church Singing, Australia, 2020
Abstract
An outbreak of severe acute respiratory syndrome coronavirus 2 infection occurred among church attendees after an infectious chorister sang at multiple services. We detected 12 secondary case-patients. Video recordings of the services showed that case-patients were seated in the same section, up to 15 m from the primary case-patient, without close physical contact, suggesting airborne transmission.
The circumstances under which airborne transmission of severe acute respiratory syndrome coronavirus 2 (SARS-CoV-2) might occur are uncertain (1,2). Previous cluster reports have suggested involvement of airborne transmission (3,4), but clear epidemiologic evidence is lacking. We investigated a SARS-CoV-2 outbreak in a church in Sydney, New South Wales, Australia, and reviewed the epidemiologic and environmental findings to assess the possibility of airborne transmission of SARS-CoV-2.
On July 18, 2020, the Western Sydney Public Health Unit was notified of a positive SARS-COV-2 test result for an 18-year-old man (PCR cycle threshold [Ct] values: envelope gene 14.5, nucleocapsid gene 16.8). He had sought testing the day before, after learning of a SARS-COV-2 exposure at a venue he attended on July 11. He reported symptom onset of malaise and headache on July 16 and cough and fever on July 17. He was a church chorist and, during his infectious period (from 48 hours before onset), had sung at four 1-hour services, 1 each on July 15 and 16 and 2 on July 17.
The case-patient had sung from a choir loft, elevated 3.5 m above the congregation, which he entered before and left after the service. He denied touching objects in the church or mixing with the general congregation. Video recordings of the services corroborated this history. We identified close contacts according to the national coronavirus disease (COVID-19) control guidelines at the time (5): anyone who had spent >15 min face-to-face or shared a closed space for 2 hours with a case-patient during the infectious period of the case-patient. Initially, 10 other chorists and staff were classified as close contacts and required to quarantine (5).
On July 18, the church informed the community about the case-patient, prompting testing among members. On July 20, the Western Sydney Public Health Unit was notified of 2 additional case-patients who reported attendance on July 15 and 16. Neither was known by the primary case-patient.
Because transmission was deemed likely to have occurred at these services, we classified all attendees of the 4 services as close contacts, required to quarantine, and requested to seek baseline SARS-CoV-2 testing regardless of symptoms (in addition to if symptoms developed). Public health staff telephoned attendees (identified by mandatory service sign-in records), released alerts through the church and media, and established a testing clinic on-site. Close contacts were contacted every 2–3 days to inquire about symptoms and advised to retest if symptoms developed.
We identified 508 close contacts across the 4 services (Table), of which 434 (85%) were recorded as having a test within 17 days after exposure. Most contacts were tested 2–7 days after exposure (Appendix Figure 1).
Figure 1
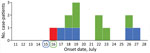
Figure 1. Epidemiologic curve of an outbreak of infection with severe acute respiratory syndrome coronavirus 2 in a church, Australia, 2020. Red indicates symptom onset date for the index case-patient, who sang...
We detected 12 secondary case-patients among 508 service attendees, yielding an overall secondary attack rate (SAR) of 2.4% across the 4 services (Table). Five case-patients attended only the service on July 15 (SAR 5/215, 2.3%), and 7 attended only on July 16 (SAR 7/120, 5.8%). One case-patient who attended on July 16 also attended on July 17; however, no case-patients were identified who attended only a service on July 17. Secondary case-patients showed development of symptoms 2–12 days after exposure (Figure 1). Five of the secondary case-patients were from the same households as earlier cluster case-patients. Thus, these case-patients might have been infected within the household rather than the church. No secondary case-patients reported other SARS-COV-2 exposures outside these services. There were no deaths, although 3 case-patients were hospitalized, including 2 who required intensive care.
SARS-CoV-2 genome sequencing was performed for the primary case-patient and 10 secondary case-patients (6). These case-patients formed a single genomic cluster with a maximum of 2 nt changes from the SARS-CoV-2 genome of the primary case-patient (Appendix Figure 2). High Ct values for the remaining 2 case-patients prohibited sequencing.
To further characterize exposures, we determined the seating positions of secondary case-patients within the church. We asked case-patients to describe where they sat, and the video recordings of the services were reviewed, jointly with the case-patients where possible, to confirm locations.
Figure 2
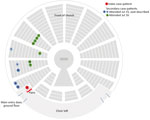
Figure 2. Schematic diagram of church layout showing seating locations of primary and secondary case-patients during an outbreak of infection with severe acute respiratory syndrome coronavirus 2, Australia, 2020. Case numbers are...
The church was round, and pews were located circumferentially. We were able to locate the exact location of 10 of the 12 secondary case-patients by using the recordings. The remaining 2 case-patients (case-patients 3 and 4) were unable to review the recordings but described the section and row in which they sat. All secondary case-patients sat within a 70° section, below and 1–15 m from the primary case-patient (Figure 2). The primary case-patient faced away from this area, and used a microphone. Cases were not detected in attendees seated in other sections, and the spatial clustering remains if the 5 potentially household-acquired case-patients are excluded (case-patients 7, 8, 10, 12, and 13). None of the other choristers showed symptoms or tested positive for SARS-CoV-2. Use of masks was not in place.
To understand the ventilation, we conducted 2 site visits with the building manager. The church had a high conical roof, and the ventilation system at the apex was not operating during the services. The doors and windows were largely closed, except as persons entered and exited, and the wall fans were off, meaning there was minimal ventilation.
We detected 12 secondary case-patients linked to an infectious case-patient at church services on 2 days. Secondary case-patients were seated in the same area of the church, up to 15 m from the primary case-patient, with whom there was no evidence of close physical contact. We believe that transmission during this outbreak is best explained by airborne spread, potentially the result of 3 factors. First, singing has been demonstrated to generate more respiratory aerosol particles and droplets than talking (7). Second, minimal ventilation might have enabled respiratory particles to accumulate in the air, and convection currents might have carried particles toward the pews where secondary case-patients were seated. Third, the primary case-patient was likely near the peak of infectiousness on the basis of low Ct values (8) and symptom onset occurring around the exposure dates (9). Although we cannot completely exclude fomite transmission, this transmission would not explain the spatial clustering of case-patients within the church over 2 days.
Strengths of our investigation include detailed case and contact follow-up, availability of video recordings of the services to confirm movements and locations of case-patients, high uptake of testing by contacts, and that SARS-CoV-2 genome sequencing provided supportive evidence that case-patients were closely related genomically. In addition, the New South Wales context of low community transmission (10) and high estimated case ascertainment (11) makes it unlikely that case-patients acquired infection outside this cluster.
A limitation was that most contacts were tested within a week of exposure, which could have been too early to detect some asymptomatic infections. Second, this investigation only provides circumstantial evidence of airborne transmission, and does not help elucidate the exact mechanism of spread. Finally, we are unsure why transmission did not occur at the services on July 17 (except in 1 possible instance); reasons might be related to altered air flow, the primary case-patient being past peak infectiousness, or that cases that did occur went undetected.
This cluster occurred despite adherence to guidelines requiring microphone use and a 3-m cordon around singers. Guidelines for places of worship were tightened after this cluster was detected, including increasing the distance required around a singer to 5 m. However additional mitigation measures might be necessary to prevent airborne infection during church services and singing, including increased natural or artificial ventilation (12) or moving activities outdoors.
Dr. Katelaris is a public health physician and field epidemiologist in the Western Sydney Local Health District Public Health Unit, Sydney, New South Wales, Australia. Her primary research interests include communicable disease control, infectious disease epidemiology, and outbreak investigation.
Acknowledgment
We thank the case-patients, church management, and wider church community for their participation and support during the outbreak management and investigations; Jennifer Paterson, Jennifer Lampard, Stephen Crone, and the Public Health Unit surge team for assistance with case and contact tracing; Kate Ward, Duleepa Jayasundara, and the Institute of Clinical Pathology and Medical Research, New South Wales Health Pathology for their contributions to the study; Aneliese Goodwin, Clement Lee, Carl Banting, Connie Lam, Karen-Ann Gray, Eby Sim, Elena Martinez, Mailie Gall, Jenny Draper, Rosemarie Sadsad, Andrew Ginn, and Qinning Wang for performing genome sequencing and bioinformatic analysis; and the New South Wales Ministry of Health Public Health Response Branch for its participation in the study.
References
- Centers for Disease Control and Prevention. Scientific brief: SARS-CoV-2 and potential airborne transmission; 2020 [cited 2020 Dec 19] https://www.cdc.gov/coronavirus/2019-ncov/more/scientific-brief-sars-cov-2.html
- Wilson N, Corbett S, Tovey E. Airborne transmission of covid-19. BMJ. 2020;370:m3206. DOIPubMedGoogle Scholar
- Lu J, Yang Z. COVID-19 outbreak associated with air conditioning in restaurant, Guangzhou, China, 2020. Emerg Infect Dis. 2020;26:2791–3. DOIPubMedGoogle Scholar
- Hamner L, Dubbel P, Capron I, Ross A, Jordan A, Lee J, et al. High SARS-CoV-2 attack rate following exposure at a choir practice— Skagit County, Washington, March 2020. MMWR Morb Mortal Wkly Rep. 2020;69:606–10. DOIPubMedGoogle Scholar
- Australian Government Department of Health. Coronavirus disease 2019 (COVID-19) communicable diseases network Australia (CDNA) national guidelines interim advice to public health units, COVID-19, version 3.4. Canberra, 2020 [cited 2021 Mar 30]. https://www1.health.gov.au/internet/main/publishing.nsf/Content/cdna-song-novel-coronavirus.htm
- Rockett RJ, Arnott A, Lam C, Sadsad R, Timms V, Gray KA, et al. Revealing COVID-19 transmission in Australia by SARS-CoV-2 genome sequencing and agent-based modeling. Nat Med. 2020;26:1398–404. DOIPubMedGoogle Scholar
- Alsved M, Matamis A, Bohlin R, Richter M, Bengtsson P, Fraenkel C, et al. Exhaled respiratory particles during singing and talking. Aerosol Sci Technol. 2020;54:1245–8. DOIGoogle Scholar
- Singanayagam A, Patel M, Charlett A, Lopez Bernal J, Saliba V, Ellis J, et al. Duration of infectiousness and correlation with RT-PCR cycle threshold values in cases of COVID-19, England, January to May 2020. Euro Surveill. 2020;25:25. DOIPubMedGoogle Scholar
- Cheng HY, Jian SW, Liu DP, Ng TC, Huang WT, Lin HH; Taiwan COVID-19 Outbreak Investigation Team. Contact tracing assessment of COVID-19 transmission dynamics in Taiwan and risk at different exposure periods before and after symptom onset. JAMA Intern Med. 2020;180:1156–63. DOIPubMedGoogle Scholar
- Health New South Wales. COVID-19 weekly surveillance in NSW, epidemiological week 29, ending 18 July 2020. NSW Government, 2020 [cited 2021 Mar 29]. https://www.health.nsw.gov.au/Infectious/covid-19/Documents/covid-19-surveillance-180720.pdf
- Price DJ, Shearer FM, Meehan M, McBryde E, Golding N, McVernon J, et al. Estimating the case detection rate and temporal variation in transmission of COVID-19 in Australia. Technical report, 2020. [cited 2020 Apr 14]. https://www.apprise.org.au/publication/estimating-the-case-detection-rate-and-temporal-variation-in-transmission-of-covid-19-in-australia/
- Morawska L, Tang JW, Bahnfleth W, Bluyssen PM, Boerstra A, Buonanno G, et al. How can airborne transmission of COVID-19 indoors be minimised? Environ Int. 2020;142:
105832 . DOIPubMedGoogle Scholar
Figures
Table
Cite This ArticleOriginal Publication Date: April 05, 2021
Table of Contents – Volume 27, Number 6—June 2021
| EID Search Options |
|---|
|
|
|
|
|
|
Please use the form below to submit correspondence to the authors or contact them at the following address:
Anthea L. Katelaris, Centre for Population Health, Locked Bag 7118, Parramatta BC 2124, NSW, Australia
Top