Volume 27, Number 7—July 2021
Research
Transmission Dynamics of African Swine Fever Virus, South Korea, 2019
Dae Sung Yoo1, Younjung Kim1 , Eune Sub Lee, Jun Sik Lim, Seong Keun Hong, Il Seob Lee, Chung Sik Jung, Ha Chung Yoon, Sung Hwan Wee, Dirk U. Pfeiffer, and Guillaume Fournié
Figure 6
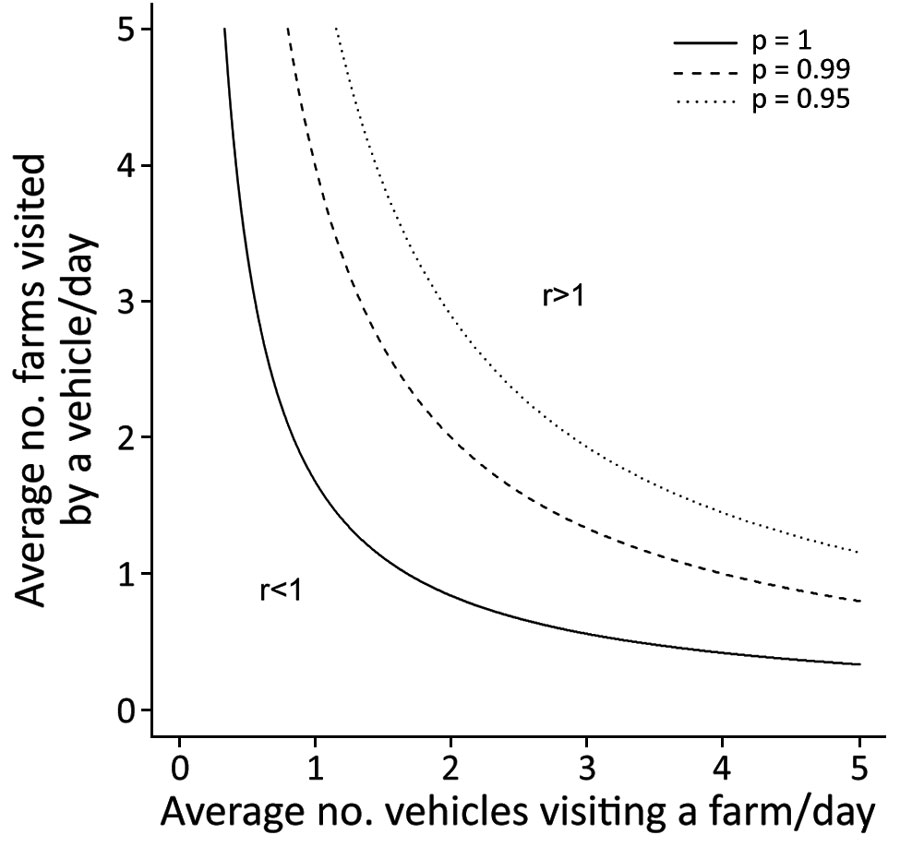
Figure 6. Expected number of secondary farm cases of African swine fever (r) caused by 1 infected farm through the movements of vehicles, South Korea, 2019. r is computed as a function of the average daily number of vehicles visiting a farm (x-axis) and the average daily number of farms visited by a vehicle (y-axis). Different lines represent different thresholds for the proportion of iterations in which r was <1 (p = 1, 0.99, or 0.95). Vehicles were assumed to remain infectious for 3 days after leaving an infected farm. Appendix Figure 9 shows the results with different assumptions on the duration of vehicle infectiousness.
1These authors contributed equally to this article.
Page created: May 14, 2021
Page updated: June 16, 2021
Page reviewed: June 16, 2021
The conclusions, findings, and opinions expressed by authors contributing to this journal do not necessarily reflect the official position of the U.S. Department of Health and Human Services, the Public Health Service, the Centers for Disease Control and Prevention, or the authors' affiliated institutions. Use of trade names is for identification only and does not imply endorsement by any of the groups named above.