Development and Clinical Evaluation of a CRISPR-Based Diagnostic for Rapid Group B Streptococcus Screening
Lingxiao Jiang
1, Weiqi Zeng
1, Wanting Wu
1, Yingying Deng, Fusheng He, Wenli Liang, Mingyao Huang, Hong Huang, Yongjun Li, Xiaorui Wang, Hang Su, Shilei Pan

, and Teng Xu
1
Author affiliations: Zhujiang Hospital, Southern Medical University, Guangzhou, China (L. Jiang, Y. Deng, W. Liang, M. Huang); Vision Medicals Center for Medical Research, Shenzhen, China (W. Zeng, W. Wu, H. Huang, Y. Li, X. Wang, H. Su, T. Xu); Key Laboratory of Animal Gene Editing and Animal Cloning in Yunnan Province and College of Veterinary Medicine, Yunnan Agricultural University, Kunming, China (W. Zeng, T. Xu); Zhujiang Hospital, Southern Medical University, Guangzhou (S. Pan)
Main Article
Figure 3
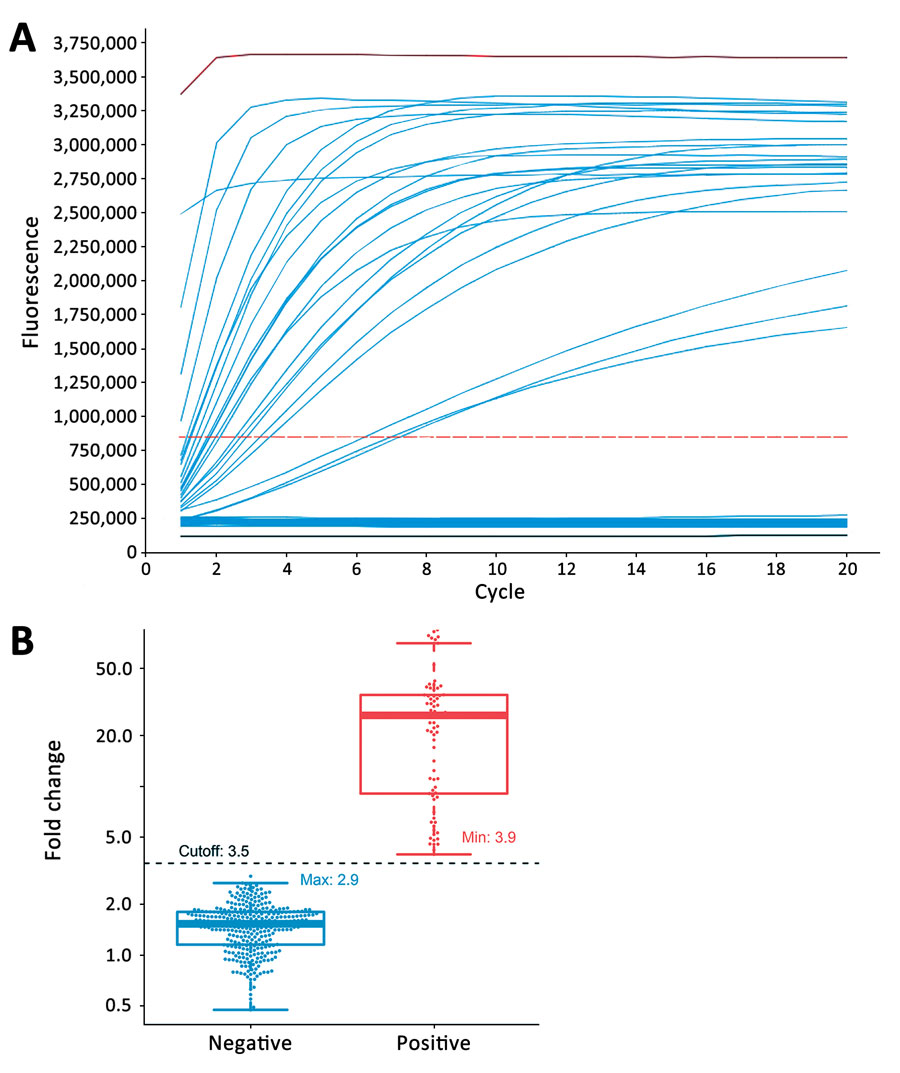
Figure 3. Determination of assay cutoff for CRISPR-based diagnostic for rapid GBS screening. A) Representative signal curves produced by CRISPR-GBS. A positive control (red), a negative control (black), and 85 clinical samples (blue) are shown with distinct curve patterns (take-off vs. flat). B) Fold-change values by CRISPR-GBS obtained from our prospective cohort: positive (with take-off signal curves in red) and negative (flat curves in blue). A cutoff of 3.5 was set and is indicated in black dashed line. GBS, group B Streptococcus. Lines from the bottom to the top of box-and-whisker plots refer to minimum, first quartile (Q1), median, third quartile (Q3), and maximum number of the dataset.
Main Article
Page created: July 14, 2021
Page updated: August 25, 2021
Page reviewed: August 25, 2021
The conclusions, findings, and opinions expressed by authors contributing to this journal do not necessarily reflect the official position of the U.S. Department of Health and Human Services, the Public Health Service, the Centers for Disease Control and Prevention, or the authors' affiliated institutions. Use of trade names is for identification only and does not imply endorsement by any of the groups named above.