Predictors of Nonseroconversion after SARS-CoV-2 Infection
Weimin Liu
1, Ronnie M. Russell
1, Frederic Bibollet-Ruche
1, Ashwin N. Skelly
1, Scott Sherrill-Mix
1, Drew A. Freeman
1, Regina Stoltz, Emily Lindemuth, Fang-Hua Lee, Sarah Sterrett, Katharine J. Bar, Nathaniel Erdmann, Sigrid Gouma, Scott E. Hensley, Thomas Ketas, Albert Cupo, Victor M. Cruz Portillo, John P. Moore, Paul D. Bieniasz, Theodora Hatziioannou, Greer Massey, Mary-Beth Minyard
2, Michael S. Saag, Randall S. Davis, George M. Shaw, William J. Britt, Sixto M. Leal, Paul Goepfert, and Beatrice H. Hahn

Author affiliations: University of Pennsylvania, Philadelphia, Pennsylvania, USA (W. Liu, R.M. Russell, F. Bibollet-Ruche, A.N. Skelly, S. Sherrill-Mix, R. Stoltz, E. Lindemuth, F.-H. Lee, K.J. Bar, S. Gouma, S.E. Hensley, G.M. Shaw, B.H. Hahn); The University of Alabama at Birmingham, Birmingham, Alabama, USA (D.A. Freeman, S. Sterrett, N. Erdmann, M.S. Saag, R.S. Davis, W.J. Britt, S.M. Leal Jr., P. Goepfert); Weill Cornell Medicine, New York, New York, USA (T. Ketas, A. Cupo, V.M. Cruz Portillo, J.P. Moore); Howard Hughes Medical Institute, New York (P.D. Bieniasz); The Rockefeller University, New York (P.D. Bieniasz, T. Hatziioannou); Assurance Scientific, Vestavia, Alabama, USA (G. Massey, M.-B. Minyard)
Main Article
Figure 2
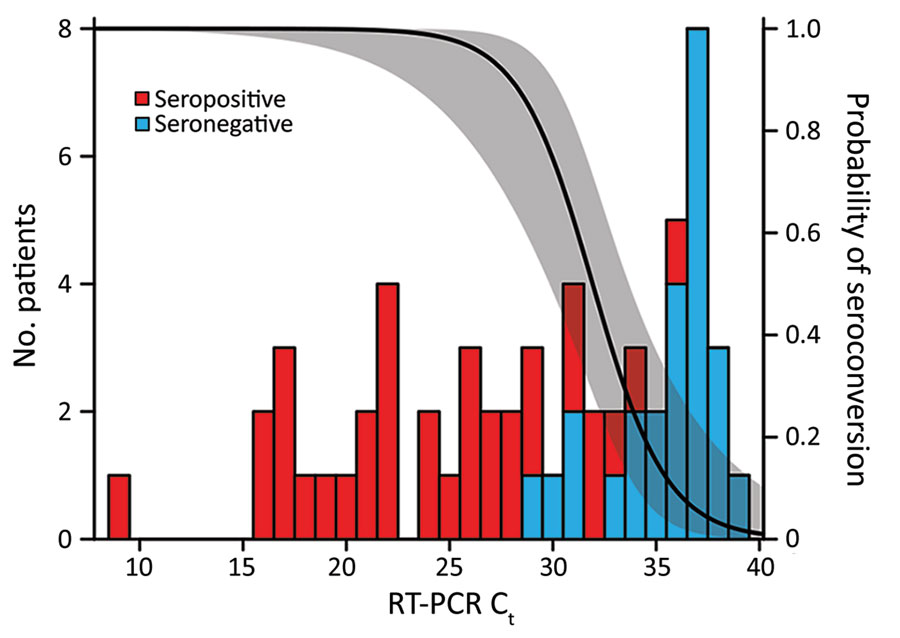
Figure 2. Decreasing probability of SARS-CoV-2 seroconversion with increasing RT-PCR Ct values among persons recovered from SARS-CoV-2 infection. Participants were a convenience sample of convalescent SARS-CoV-2–infected persons recruited at the University of Alabama at Birmingham, Birmingham, Alabama, USA, 2020. The number of serologic responders (red bars) and nonresponders (blue bars) is shown for varying RT-PCR Ct values. A logistic regression was used to estimate the probability of seroconversion for a given Ct (line) and its 95% CI (shaded). Ct, cycle threshold; RT-PCR, reverse transcription PCR; SARS-CoV-2, severe acute respiratory syndrome coronavirus 2.
Main Article
Page created: June 30, 2021
Page updated: August 18, 2021
Page reviewed: August 18, 2021
The conclusions, findings, and opinions expressed by authors contributing to this journal do not necessarily reflect the official position of the U.S. Department of Health and Human Services, the Public Health Service, the Centers for Disease Control and Prevention, or the authors' affiliated institutions. Use of trade names is for identification only and does not imply endorsement by any of the groups named above.