Skip directly to site content Skip directly to page options Skip directly to A-Z link Skip directly to A-Z link Skip directly to A-Z link
Volume 28, Number 1—January 2022
Research

Transmission Dynamics of Large Coronavirus Disease Outbreak in Homeless Shelter, Chicago, Illinois, USA, 2020

Yi-Shin Chang, Stockton Mayer, Elizabeth S. Davis, Evelyn Figueroa, Paul Leo, Patricia W. Finn1Comments to Author , and David L. Perkins1
Author affiliations: University of Illinois at Chicago, Chicago, Illinois, USA (Y.-S. Chang, S. Mayer, E. Figueroa, P. Leo, P.W. Finn, D.L. Perkins); Rush University Medical Center, Chicago (E.S. Davis)

Main Article

Figure 4

Compartmental modeling results of the coronavirus disease outbreak at Pacific Garden Mission, a homeless shelter in Chicago, Illinois, USA, 2020. The 4 phases of the outbreak are designated above the graph, and time points corresponding to each of the 4 rounds of mass testing and isolation are indicated by vertical dotted lines and vertical dashed lines. The susceptible compartment corresponds to persons who are estimated to have never been infected; exposed persons have been infected but are not yet infectious; infectious includes persons in both Is and Ia; recovered include the R+s, R+a, and R– compartments; isolation unit/removed persons tested positive by reverse transcription PCR and either left the shelter or were moved to isolation units. The discontinuities in the isolation unit/removed, infectious, and recovered curves at each of the isolation time points (dotted lines) represent persons who tested positive by reverse transcription PCR (those in the Is, Ia, R+s, and R+a compartments) at the respective testing time point (dashed lines) being moved to the Isolation Unit compartment with each of the 4 rounds of mass testing. The 95% CIs for the compartments represent maximum and minimum values for each trajectory when reperforming model optimization with β0 (initial transmission rate) fixed over its 95% CI (0.45–0.74) derived from initial model optimization (β0 = 0.60). Corresponding description of compartments, systems of ordinary differential equations, and parameter descriptions are described in detail in the Appendix.

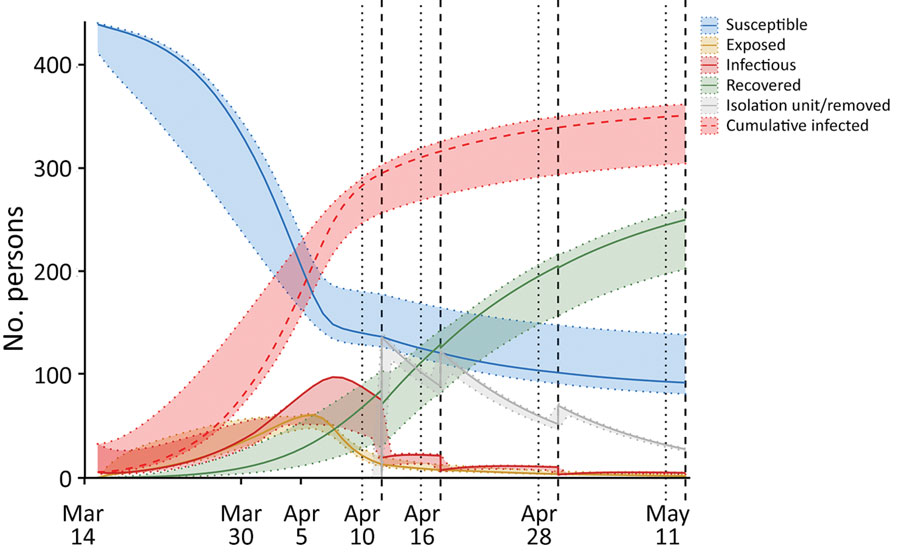
Figure 4. Compartmental modeling results of the coronavirus disease outbreak at Pacific Garden Mission, a homeless shelter in Chicago, Illinois, USA, 2020. The 4 phases of the outbreak are designated above the graph, and time points corresponding to each of the 4 rounds of mass testing and isolation are indicated by vertical dotted lines and vertical dashed lines. The susceptible compartment corresponds to persons who are estimated to have never been infected; exposed persons have been infected but are not yet infectious; infectious includes persons in both Is and Ia; recovered include the R+s, R+a, and R– compartments; isolation unit/removed persons tested positive by reverse transcription PCR and either left the shelter or were moved to isolation units. The discontinuities in the isolation unit/removed, infectious, and recovered curves at each of the isolation time points (dotted lines) represent persons who tested positive by reverse transcription PCR (those in the Is, Ia, R+s, and R+a compartments) at the respective testing time point (dashed lines) being moved to the Isolation Unit compartment with each of the 4 rounds of mass testing. The 95% CIs for the compartments represent maximum and minimum values for each trajectory when reperforming model optimization with β0 (initial transmission rate) fixed over its 95% CI (0.45–0.74) derived from initial model optimization (β0 = 0.60). Corresponding description of compartments, systems of ordinary differential equations, and parameter descriptions are described in detail in the Appendix.

Main Article

1These senior authors contributed equally to this article.

Page created: October 08, 2021
Page updated: December 20, 2021
Page reviewed: December 20, 2021
The conclusions, findings, and opinions expressed by authors contributing to this journal do not necessarily reflect the official position of the U.S. Department of Health and Human Services, the Public Health Service, the Centers for Disease Control and Prevention, or the authors' affiliated institutions. Use of trade names is for identification only and does not imply endorsement by any of the groups named above.
file_external