Skip directly to site content Skip directly to page options Skip directly to A-Z link Skip directly to A-Z link Skip directly to A-Z link
Volume 28, Number 10—October 2022
Research

SARS-CoV-2 Vaccine Breakthrough by Omicron and Delta Variants, New York, USA

Alexander C. KeyelComments to Author , Alexis Russell, Jonathan Plitnick, Jemma V. Rowlands, Daryl M. Lamson, Eli Rosenberg, and Kirsten St. George
Author affiliations: New York State Department of Health, Albany, New York, USA (A.C. Keyel, A. Russell, J. Plitnick, J.V. Rowlands, D.M. Lamson, E. Rosenberg, K. St. George); State University of New York, Albany (E. Rosenberg, K. St. George)

Main Article

Figure 1

Matched case–control pairs used in the conditional logistic regression by analysis for the SARS-CoV-2 Delta variant (March 19, 2021–August 15, 2021) and the Omicron variant (November 28, 2021–January 24, 2022) emergence periods, by economic region (map), New York, USA. The bars correspond to the order given in the legend; New York City is on top when present and Long Island on bottom when present. The dashed line separates the 2 datasets used in the analyses; the Delta emergence period is on the left and the Omicron emergence period on the right. Map base layer was derived from a combination of 2 public domain layers (US Census data, https://www.census.gov/geo/maps-data/data/tiger-line.html) and Natural Earth Administrative boundaries (https://www.naturalearthdata.com/downloads/50m-cultural-vectors/50m-admin-1-states-provinces).

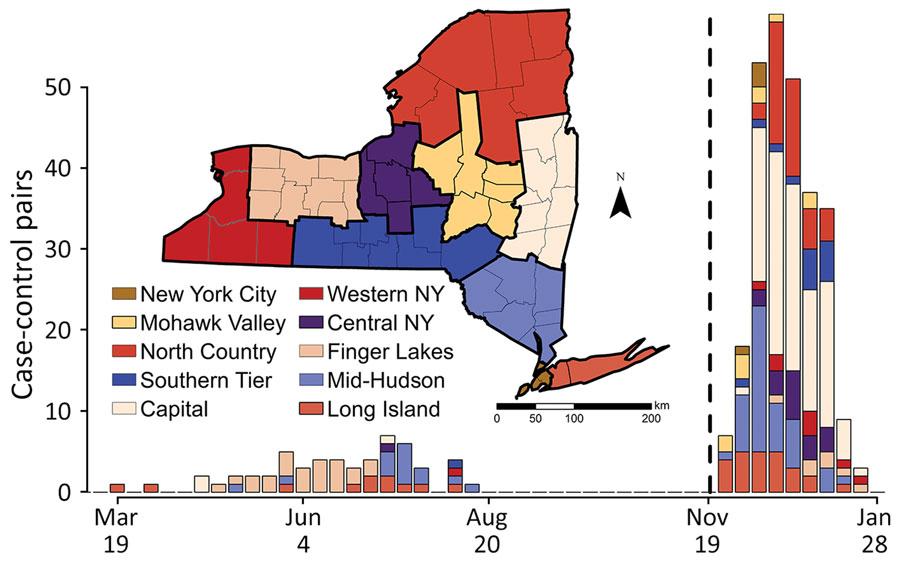
Figure 1. Matched case–control pairs used in the conditional logistic regression by analysis for the SARS-CoV-2 Delta variant (March 19, 2021–August 15, 2021) and the Omicron variant (November 28, 2021–January 24, 2022) emergence periods, by economic region (map), New York, USA. The bars correspond to the order given in the legend; New York City is on top when present and Long Island on bottom when present. The dashed line separates the 2 datasets used in the analyses; the Delta emergence period is on the left and the Omicron emergence period on the right. Map base layer was derived from a combination of 2 public domain layers (US Census data, https://www.census.gov/geo/maps-data/data/tiger-line.html) and Natural Earth Administrative boundaries (https://www.naturalearthdata.com/downloads/50m-cultural-vectors/50m-admin-1-states-provinces).

Main Article

Page created: August 25, 2022
Page updated: September 20, 2022
Page reviewed: September 20, 2022
The conclusions, findings, and opinions expressed by authors contributing to this journal do not necessarily reflect the official position of the U.S. Department of Health and Human Services, the Public Health Service, the Centers for Disease Control and Prevention, or the authors' affiliated institutions. Use of trade names is for identification only and does not imply endorsement by any of the groups named above.
file_external