Continued Circulation of Tick-Borne Encephalitis Virus Variants and Detection of Novel Transmission Foci, the Netherlands
Helen J. Esser

, Stephanie M. Lim, Ankje de Vries, Hein Sprong, Dinant J. Dekker, Emily L. Pascoe, Julian W. Bakker, Vanessa Suin, Eelco Franz, Byron E.E. Martina, and Constantianus J.M. Koenraadt
Author affiliations: Wageningen University and Research, Wageningen, the Netherlands (H.J. Esser, D.J. Dekker, E.L. Pascoe, J.W. Bakker, C.J.M. Koenraadt); Artemis One Health Research Institute, Delft, the Netherlands (S.M. Lim, B.E.E. Martina); National Institute for Public Health and the Environment, Bilthoven, the Netherlands (A. de Vries, H. Sprong, E. Franz); Sciensano, Brussels, Belgium (V. Suin)
Main Article
Figure 2
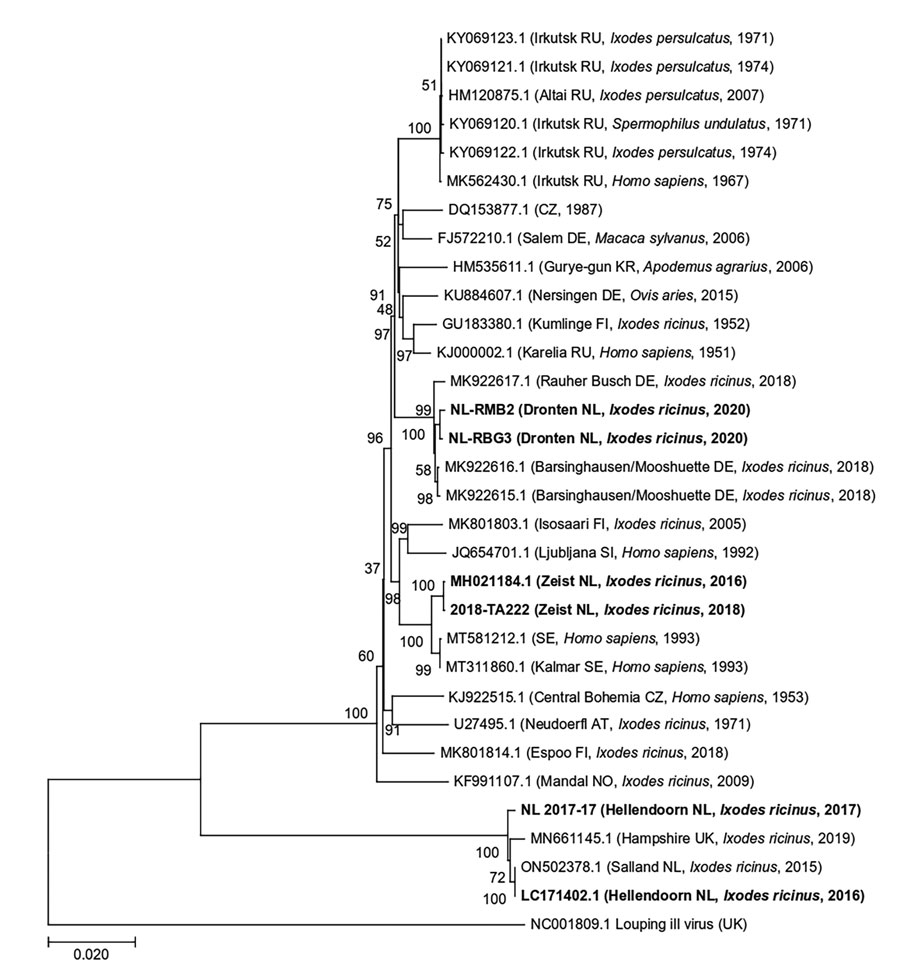
Figure 2. Maximum-likelihood phylogenetic tree of polyprotein sequences obtained from tick-borne encephalitis virus RNA–positive Ixodes ricinus ticks collected from 3 locations in the Netherlands during 2016–2020 (in bold). Additional published sequences obtained from GenBank are included for reference. Louping ill virus is used as the outgroup. Sample ID or GenBank accession numbers are indicated for each sequence, with location in brackets (if known) and country code, original isolation source, and collection year of each sample. Numbers next to each branch indicate the percentage of trees resulting from bootstrapping on the basis of 1,000 pseudoreplicate datasets for which the associated taxa clustered together. Scale bar represents the percentage of genetic variation along tree branches.
Main Article
Page created: September 16, 2022
Page updated: November 21, 2022
Page reviewed: November 21, 2022
The conclusions, findings, and opinions expressed by authors contributing to this journal do not necessarily reflect the official position of the U.S. Department of Health and Human Services, the Public Health Service, the Centers for Disease Control and Prevention, or the authors' affiliated institutions. Use of trade names is for identification only and does not imply endorsement by any of the groups named above.