Adapting Longstanding Public Health Collaborations between Government of Kenya and CDC Kenya in Response to the COVID-19 Pandemic, 2020–2021
Amy Herman-Roloff

, Rashid Aman, Taraz Samandari, Kadondi Kasera, Gideon O. Emukule, Patrick Amoth, Tai-Ho Chen, Jackton Kisivuli, Herman Weyenga, Elizabeth Hunsperger, Clayton Onyango, Bonventure Juma, Peninah Munyua, Daniel Wako, Victor Akelo, Davies Kimanga, Linus Ndegwa, Ahmed Abade Mohamed, Peter Okello, Samuel Kariuki, Kevin M. De Cock, Marc Bulterys, and
CDC-Kenya COVID-19 Response Team
Author affiliations: US Centers for Disease Control and Prevention (CDC), Nairobi and Kisumu, Kenya (A. Herman-Roloff, T. Samandari, G. Emukule, T.-H. Chen, H. Weyenga, E. Hunsperger, C. Onyango, B. Juma, P. Munyua, D. Wako, V. Akelo, D. Kimanga, L. Ndegwa, K.M. De Cock, M. Bulterys); Ministry of Health, Nairobi (R. Aman, K. Kasera, P. Amoth); Kenya Prisons Service, Nairobi (J. Kisivuli, P. Okello); Africa Field Epidemiology Network, Nairobi (A.A. Mohamed); Kenya Medical Research Institute, Nairobi (S. Kariuki)
Main Article
Figure 1
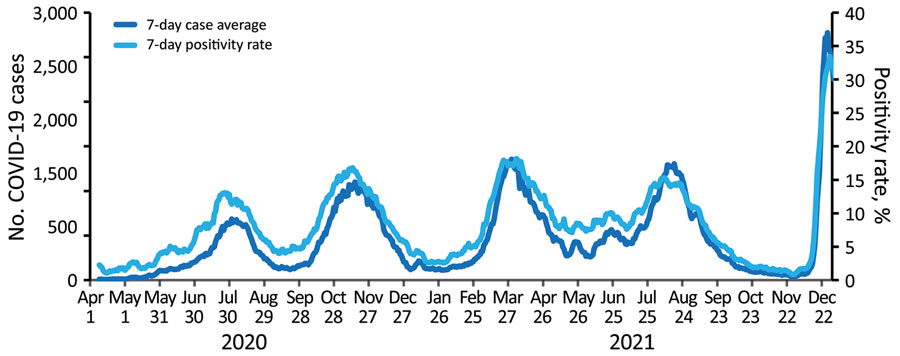
Figure 1. Average number of laboratory-confirmed COVID-19 cases and SARS-CoV-2 positivity rates in Kenya from April 1, 2020, through December 26, 2021, in a review of longstanding public health collaborations between the government of Kenya and CDC Kenya in response to the COVID-19 pandemic. The US Centers for Disease Control and Prevention in Kenya supports the Kenya Ministry of Health with COVID-19 data analysis and visualization. By December 26, 2021, Kenya had experienced 5 epidemic waves during July and November in 2020 and March, August, and December in 2021; a total of 282,554 laboratory-confirmed COVID-19 cases, 5,361 related deaths, and a case fatality rate of 1.9% were reported. The graph shows the 7-day averages for the number of COVID-19 cases and positivity rates.
Main Article
Page created: November 01, 2022
Page updated: December 11, 2022
Page reviewed: December 11, 2022
The conclusions, findings, and opinions expressed by authors contributing to this journal do not necessarily reflect the official position of the U.S. Department of Health and Human Services, the Public Health Service, the Centers for Disease Control and Prevention, or the authors' affiliated institutions. Use of trade names is for identification only and does not imply endorsement by any of the groups named above.