Skip directly to site content Skip directly to page options Skip directly to A-Z link Skip directly to A-Z link Skip directly to A-Z link
Volume 28, Number 2—February 2022
Research Letter

Genetic Diversity of Bartonella spp. in Cave-Dwelling Bats and Bat Flies, Costa Rica, 2018

Miranda M. Mitchell1, Amanda Vicente-Santos1, Bernal Rodríguez-Herrera, Eugenia Corrales-Aguilar, and Thomas R. GillespieComments to Author 
Author affiliations: Emory University, Atlanta, Georgia, USA (M.M. Mitchell, A. Vicente-Santos, T.R. Gillespie); University of Costa Rica, San José, Costa Rica (B. Rodríguez-Herrera, E. Corrales-Aguilar)

Main Article

Figure

Phylogenetic tree of 768 bp partial gltA gene of Bartonella variants found in study of Bartonella spp. in bats and bat flies sampled from roost sites, Costa Rica, 2018 (blue), compared with globally named species and other variants found in bats and bat flies in Central America and Mexico. Each sequence is labeled with its GenBank accession number, the organism on which it was detected, and the country of origin. For species in this study, we included the specific site (accession numbers in Appendix Table). Underlining indicates the potential newly described genotypes. We constructed the global phylogenetic tree by using Bayesian Markov chain Monte Carlo (MrBayes 2.2.4, https://www.geneious.com), with 1 million generations and a burn-in fraction of 25%. We determined the parameters for the nucleotide changes by using MEGA X (https://mafft.cbrc.jp/alignment/software). Inner node labels identify consensus support. Scale bar indicates nucleotide substitutions/site (%).

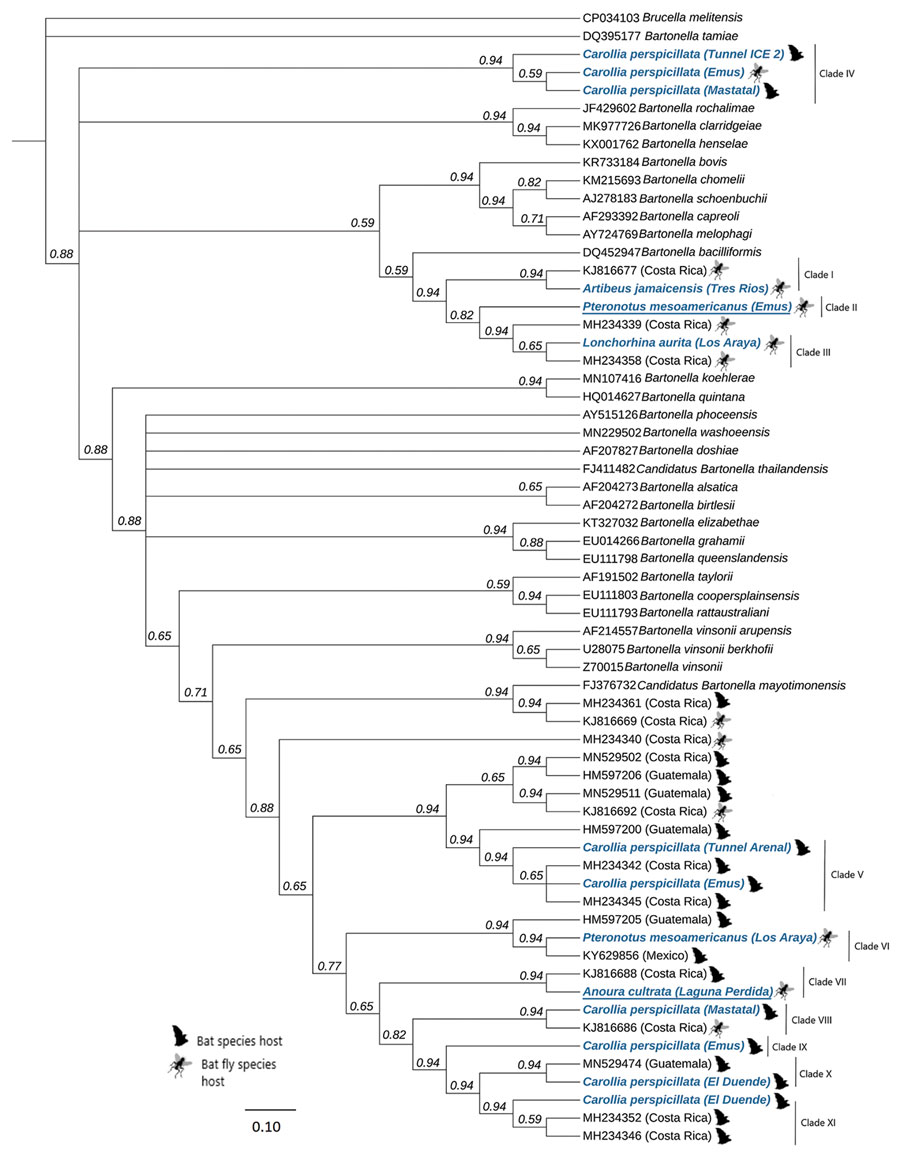
Figure. Phylogenetic tree of 768 bp partial gltA gene of Bartonella variants found in study of Bartonella spp. in bats and bat flies sampled from roost sites, Costa Rica, 2018 (blue), compared with globally named species and other variants found in bats and bat flies in Central America and Mexico. Each sequence is labeled with its GenBank accession number, the organism on which it was detected, and the country of origin. For species in this study, we included the specific site (accession numbers in Appendix Table). Underlining indicates the potential newly described genotypes. We constructed the global phylogenetic tree by using Bayesian Markov chain Monte Carlo (MrBayes 2.2.4, https://www.geneious.com), with 1 million generations and a burn-in fraction of 25%. We determined the parameters for the nucleotide changes by using MEGA X (https://mafft.cbrc.jp/alignment/software). Inner node labels identify consensus support. Scale bar indicates nucleotide substitutions/site (%).

Main Article

1These authors contributed equally to this article.

Page created: December 03, 2021
Page updated: January 22, 2022
Page reviewed: January 22, 2022
The conclusions, findings, and opinions expressed by authors contributing to this journal do not necessarily reflect the official position of the U.S. Department of Health and Human Services, the Public Health Service, the Centers for Disease Control and Prevention, or the authors' affiliated institutions. Use of trade names is for identification only and does not imply endorsement by any of the groups named above.
file_external