Infection Control Measures and Prevalence of SARS-CoV-2 IgG among 4,554 University Hospital Employees, Munich, Germany
Johanna Erber, Verena Kappler, Bernhard Haller, Hrvoje Mijočević, Ana Galhoz, Clarissa Prazeres da Costa, Friedemann Gebhardt, Natalia Graf, Dieter Hoffmann, Markus Thaler, Elke Lorenz, Hedwig Roggendorf, Florian Kohlmayer, Andreas Henkel, Michael P. Menden, Jürgen Ruland, Christoph D. Spinner, Ulrike Protzer
1, Percy Knolle
1, Paul Lingor
1
, and
on behalf of the SeCoMRI Study Group2
Author affiliations: University Hospital rechts der Isar, Munich, Germany (J. Erber, V. Kappler, B. Haller, H. Mijočević, C. Prazeres da Costa, F. Gebhardt, N. Graf, D. Hoffmann, M. Thaler, H. Roggendorf, F. Kohlmayer, A. Henkel, J. Ruland, C.D. Spinner, U. Protzer, P. Knolle, P. Lingor); German Center for Infection Research, Munich (J. Erber, D. Hoffmann, J. Ruland, U. Protzer, C.D. Spinner); Helmholtz Zentrum München-German, Neuherberg, Germany (A. Galhoz, M.P. Menden); Ludwig-Maximilians University Munich, Martinsried, Germany (A. Galhoz, M.P. Menden); German Center for Diabetes Research, Neuherberg (M.P. Menden); Technical University of Munich, Munich (M.P. Menden)
Main Article
Figure 1
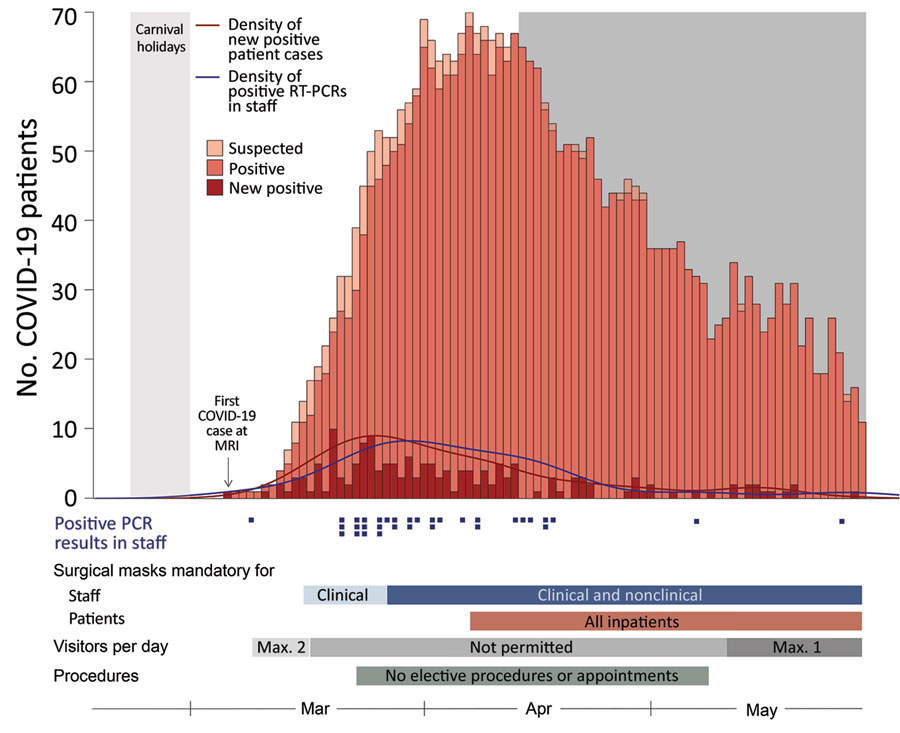
Figure 1. Prevalence and distribution of severe acute respiratory syndrome coronavirus 2 (SARS-CoV-2) infections in patients and staff at a university hospital in Munich, Germany. Shown is the number of all COVID-19 patients admitted to the hospital; the first COVID-19 patient was admitted on March 6, 2020. Light gray shading indicates dates of carnival holidays (February 22‒March 1, 2020); dark gray shading indicates dates of seroprevalence study (April 14‒May 29, 2020). Blue squares below graph indicate positive RT-PCR test results for SARS-CoV-2 RNA in university hospital staff. Bars below graph indicate densities of positive RT-PCR test results in staff (blue), new COVID-19 cases in patients (red), and limitations on number of visitors allowed and elective procedures and appointments (gray). COVID-19, coronavirus disease; Max., maximum; MRI, University Hospital Munich Rechts der Isar; RT-PCR, reverse transcription PCR.
Main Article
Page created: December 15, 2021
Page updated: February 21, 2022
Page reviewed: February 21, 2022
The conclusions, findings, and opinions expressed by authors contributing to this journal do not necessarily reflect the official position of the U.S. Department of Health and Human Services, the Public Health Service, the Centers for Disease Control and Prevention, or the authors' affiliated institutions. Use of trade names is for identification only and does not imply endorsement by any of the groups named above.