Volume 28, Number 3—March 2022
CME ACTIVITY - Synopsis
Rising Incidence of Legionnaires’ Disease and Associated Epidemiologic Patterns, United States, 1992–2018
Albert E. Barskey , Gordana Derado, and Chris Edens
Figure 2
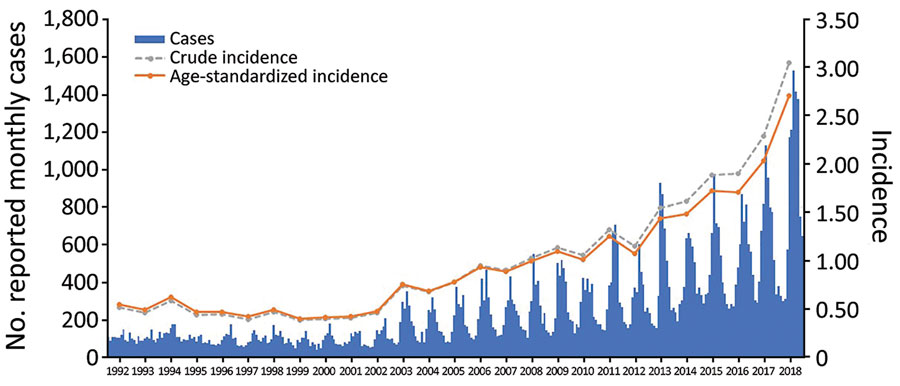
Figure 2. Reported cases of Legionnaires’ disease by month and incidence (cases/100,000 population) by year, United States,1992–2018. Monthly cases reported to the Centers for Disease Control and Prevention through the National Notifiable Diseases Surveillance System and the crude and age-standardized annual incidence for 1992–2018 are shown.
Page created: January 05, 2022
Page updated: February 17, 2022
Page reviewed: February 17, 2022
The conclusions, findings, and opinions expressed by authors contributing to this journal do not necessarily reflect the official position of the U.S. Department of Health and Human Services, the Public Health Service, the Centers for Disease Control and Prevention, or the authors' affiliated institutions. Use of trade names is for identification only and does not imply endorsement by any of the groups named above.