Volume 28, Number 5—May 2022
Research
Effects of Tick-Control Interventions on Tick Abundance, Human Encounters with Ticks, and Incidence of Tickborne Diseases in Residential Neighborhoods, New York, USA
Felicia Keesing1 , Stacy Mowry, William Bremer, Shannon Duerr, Andrew S. Evans, Ilya R. Fischhoff, Alison F. Hinckley, Sarah A. Hook, Fiona Keating, Jennifer Pendleton, Ashley Pfister, Marissa Teator, and Richard S. Ostfeld1
Figure 2
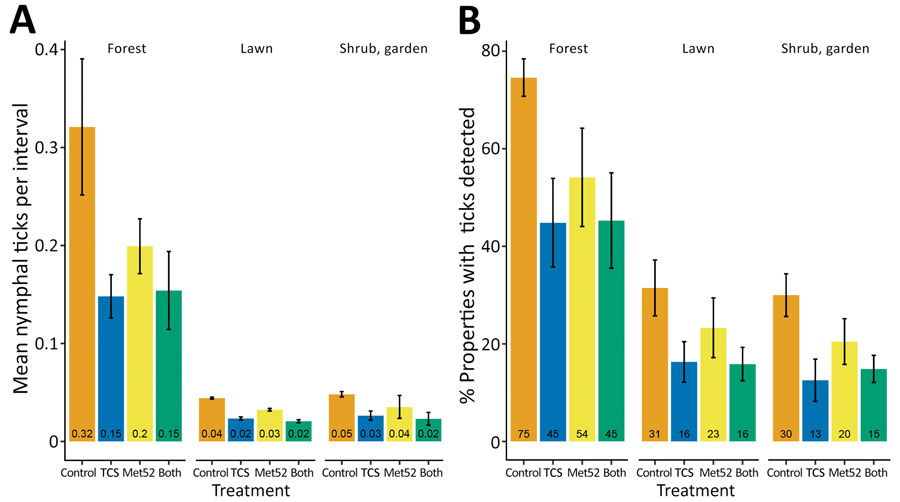
Figure 2. Detection of questing nymphal ticks during study of tick-control interventions in residential neighborhoods, New York, USA. A) Mean number of questing nymphal ticks per flagging interval (Appendix). B) Mean percentage of properties with questing nymphal ticks detected for each treatment group and in each habitat type (forest, lawn, shrub or garden). Totals are averaged over 3 years for each neighborhood. Data include ticks from the nymphal sampling period in May–July. Error bars represent SEM. TCS, Tick Control System.
1These authors contributed equally to this article and were co-principal investigators.
Page created: March 07, 2022
Page updated: April 19, 2022
Page reviewed: April 19, 2022
The conclusions, findings, and opinions expressed by authors contributing to this journal do not necessarily reflect the official position of the U.S. Department of Health and Human Services, the Public Health Service, the Centers for Disease Control and Prevention, or the authors' affiliated institutions. Use of trade names is for identification only and does not imply endorsement by any of the groups named above.