Volume 28, Number 6—June 2022
Research
Geographic Origin and Vertical Transmission of Leishmania infantum Parasites in Hunting Hounds, United States
Figure 2
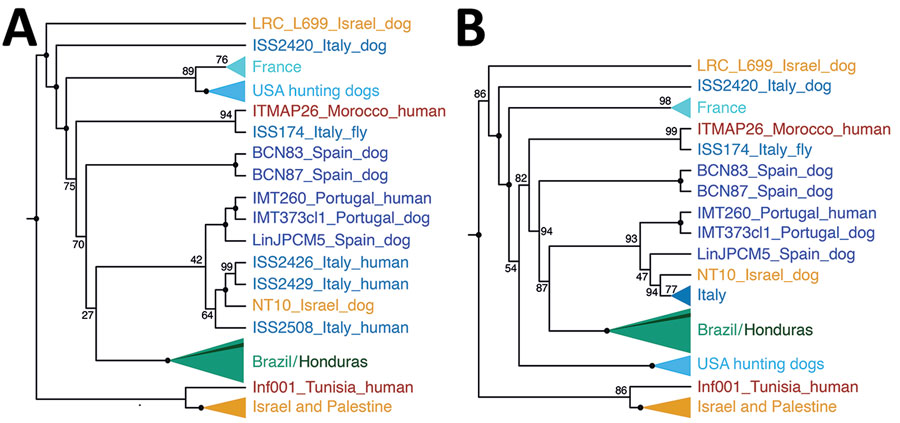
Figure 2. Geographic origin of US hound Leishmania isolates. A) Cladogram of the neighbor-joining tree from Figure 1 showing monophyletic groups for better visibility of evolutionary relationships of the US hound parasites. B) Cladogram of the maximum-likelihood phylogeny (Appendix 2 Figure 2, panel B). Cladograms were reconstructed on the basis of whole-genome genotype calls of 83 parasite samples representing the dominant L. infantum zymodeme MON-1 from the United States, Europe, South America, and the Middle East, which were the samples most relevant in the context of the origin of the US samples (Appendix 2 Figure 2). Numbers at internal nodes show bootstrap values.
1These senior authors contributed equally to this article.
Page created: April 12, 2022
Page updated: May 22, 2022
Page reviewed: May 22, 2022
The conclusions, findings, and opinions expressed by authors contributing to this journal do not necessarily reflect the official position of the U.S. Department of Health and Human Services, the Public Health Service, the Centers for Disease Control and Prevention, or the authors' affiliated institutions. Use of trade names is for identification only and does not imply endorsement by any of the groups named above.