Skip directly to site content Skip directly to page options Skip directly to A-Z link Skip directly to A-Z link Skip directly to A-Z link
Volume 28, Number 6—June 2022
Dispatch

Fasciolopsis buski Detected in Humans in Bihar and Pigs in Assam, India

Dipshikha Saikia1, Yugal K. Prasad1, Suman Dahal, and Sudeep GhataniComments to Author 
Author affiliations: Sikkim University, Gangtok, India (D. Saikia, S. Dahal, S. Ghatani); Shri Shubh Lal Hospital and Research Centre, Sitamarhi, India (Y.K. Prasad)

Main Article

Figure 2

Phylogenetic trees for study strains of Fasciolopsis buski trematodes recovered from child patients in Sitamarhi, Bihar, and pigs in Sivasagar, Assam, India, and reference sequences. Red indicates isolates from India; asterisks indicate strains from this study. Tree was constructed using the maximum-likelihood method as implemented in MrBayes version 3.1.2 (https://bioweb.pasteur.fr/packages/pack@mrbayes@3.1.2). A) Internal transcribed spacer 2 gene tree using Hasegawa-Kishino-Yano plus invariate sites model. B) Cytochrome c oxidase subunit 1 gene tree using general time reversible plus gamma model. The analyses were run for 5,000,000 generations with sampling frequency of 100 and initial 25% of the trees discarded as burn-in. Node values represent Bayesian posterior probabilities. GenBank accession numbers are provided when available. Scale bars represent branch length.

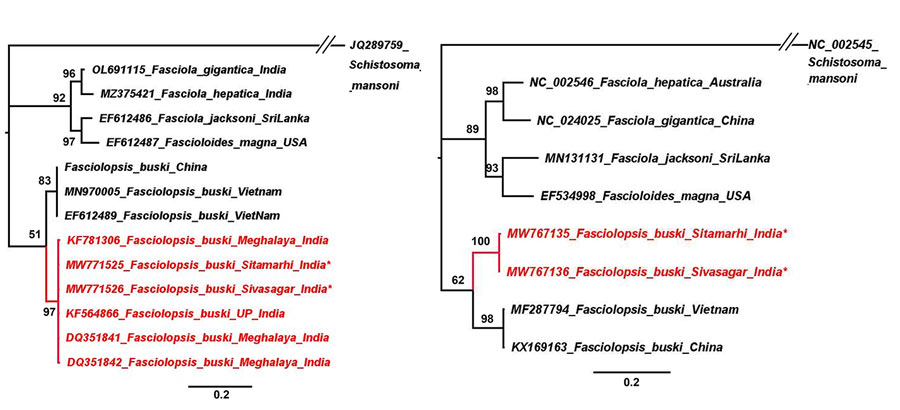
Figure 2. Phylogenetic trees for study strains of Fasciolopsis buski trematodes recovered from child patients in Sitamarhi, Bihar, and pigs in Sivasagar, Assam, India, and reference sequences. Red indicates isolates from India; asterisks indicate strains from this study. Tree was constructed using the maximum-likelihood method as implemented in MrBayes version 3.1.2 (https://bioweb.pasteur.fr/packages/pack@mrbayes@3.1.2). A) Internal transcribed spacer 2 gene tree using Hasegawa-Kishino-Yano plus invariate sites model. B) Cytochrome c oxidase subunit 1 gene tree using general time reversible plus gamma model. The analyses were run for 5,000,000 generations with sampling frequency of 100 and initial 25% of the trees discarded as burn-in. Node values represent Bayesian posterior probabilities. GenBank accession numbers are provided when available. Scale bars represent branch length.

Main Article

1These first authors contributed equally to this article.

Page created: April 12, 2022
Page updated: May 26, 2022
Page reviewed: May 26, 2022
The conclusions, findings, and opinions expressed by authors contributing to this journal do not necessarily reflect the official position of the U.S. Department of Health and Human Services, the Public Health Service, the Centers for Disease Control and Prevention, or the authors' affiliated institutions. Use of trade names is for identification only and does not imply endorsement by any of the groups named above.
file_external