Skip directly to site content Skip directly to page options Skip directly to A-Z link Skip directly to A-Z link Skip directly to A-Z link
Volume 28, Number 7—July 2022
Dispatch

Highly Pathogenic Avian Influenza A(H5N8) Clade 2.3.4.4b Virus in Dust Samples from Poultry Farms, France, 2021

Fabien Filaire, Laetitia Lebre, Charlotte Foret-Lucas, Timothée Vergne, Patrick Daniel, Aurélie Lelièvre, Antoine de Barros, Adam Jbenyeni, Pierrick Bolon, Mathilde Paul, Guillaume Croville, and Jean-Luc Guérin
Author affiliations: THESEO France, Laval, France (F. Filaire); Université de Toulouse, Toulouse, France (F. Filaire, L. Lebre, C. Foret-Lucas, T. Vergne, A. De Barros, A. Jbenyeni, P. Bolon, M. Paul, G. Croville, J.-L. Guérin); Laboratoires des Pyrénées et des Landes, Mont-de-Marsan, France (P. Daniel); SOCSA 40, Amou, France (A. Lelièvre)

Main Article

Figure 1

Ct values of highly pathogenic avian influenza A(H5N8) clade 2.3.4.4b virus detected by real-time qualitative reverse transcription PCR from tracheal swab and environmental samples collected on poultry farms, France, December 2020–April 2021. We used a Wilcoxon test for statistical analysis and considered samples with Ct <40 negative. Each dot indicates a Ct value from 1 wipe sample or 1 pool of 5 tracheal swab samples. Box plots show 95% CI for Ct values; horizontal lines in boxes indicate means and error bars SDs. Red dashed horizontal lines indicate Ct of 40, the cutoff value for negative results. A) Half-violin, scatter, and box plots of Ct values for samples collected by using tracheal swab samples or surface wipe samples from 63 poultry houses with and without clinical signs among animals. Half-violins show distribution of Ct values for each sample type. B) Ct values for aerosol samples collected in 19 poultry houses. Aerosol samples were collected by using the Coriolis Compact (Bertin Instruments, https://www.bertin-instruments.com) and the NIOSH BC 251 (https://www.cdc.gov/niosh). The NIOSH BC 251 sampling device has 3 fractions for different particle sizes; fraction 1 for >4 µm, fraction 2 for 1–4 µm, and fraction 3 for <1 µm. Ct, cycle threshold; NIOSH, National Institute for Occupational Safety and Health.

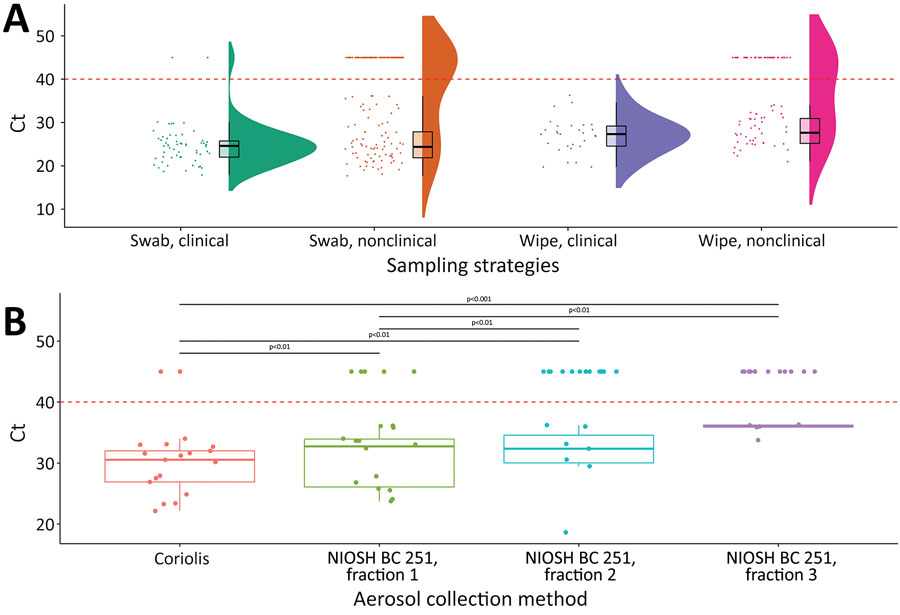
Figure 1. Ct values of highly pathogenic avian influenza A(H5N8) clade 2.3.4.4b virus detected by real-time qualitative reverse transcription PCR from tracheal swab and environmental samples collected on poultry farms, France, December 2020–April 2021. We used a Wilcoxon test for statistical analysis and considered samples with Ct <40 negative. Each dot indicates a Ct value from 1 wipe sample or 1 pool of 5 tracheal swab samples. Box plots show 95% CI for Ct values; horizontal lines in boxes indicate means and error bars SDs. Red dashed horizontal lines indicate Ct of 40, the cutoff value for negative results. A) Half-violin, scatter, and box plots of Ct values for samples collected by using tracheal swab samples or surface wipe samples from 63 poultry houses with and without clinical signs among animals. Half-violins show distribution of Ct values for each sample type. B) Ct values for aerosol samples collected in 19 poultry houses. Aerosol samples were collected by using the Coriolis Compact (Bertin Instruments, https://www.bertin-instruments.com) and the NIOSH BC 251 (https://www.cdc.gov/niosh). The NIOSH BC 251 sampling device has 3 fractions for different particle sizes; fraction 1 for >4 µm, fraction 2 for 1–4 µm, and fraction 3 for <1 µm. Ct, cycle threshold; NIOSH, National Institute for Occupational Safety and Health.

Main Article

Page created: May 03, 2022
Page updated: June 18, 2022
Page reviewed: June 18, 2022
The conclusions, findings, and opinions expressed by authors contributing to this journal do not necessarily reflect the official position of the U.S. Department of Health and Human Services, the Public Health Service, the Centers for Disease Control and Prevention, or the authors' affiliated institutions. Use of trade names is for identification only and does not imply endorsement by any of the groups named above.
file_external