Skip directly to site content Skip directly to page options Skip directly to A-Z link Skip directly to A-Z link Skip directly to A-Z link
Volume 28, Number 7—July 2022
Research

Analyzing and Modeling the Spread of SARS-CoV-2 Omicron Lineages BA.1 and BA.2, France, September 2021–February 2022

Mircea T. Sofonea, Bénédicte Roquebert, Vincent Foulongne, David Morquin, Laura Verdurme, Sabine Trombert-Paolantoni, Mathilde Roussel, Jean-Christophe Bonetti, Judith Zerah, Stéphanie Haim-Boukobza, and Samuel AlizonComments to Author 
Author affiliations: Université de Montpellier, Montpellier, France (M.T. Sofonea); Laboratoire Cerba, Saint Ouen L’Aumône, France (B. Roquebert, L. Verdurme, S. Trombert-Paolantoni, M. Roussel, S. Haim-Boukobza); Centre Hospitalier Universitaire de Montpellier, Montpellier (V. Foulongne, D. Morquin); Laboratoire Cerballiance Paris et Île-de-France Est, Paris, France (J.-C. Bonetti, J. Zerah); Centre National de la Recherche Scientifique, Paris (S. Alizon)

Main Article

Figure 7

Analyzing and modeling the SARS-CoV-2 Omicron BA.2 epidemic wave in France. A) Ratio between the predicted and observed reproduction number (R0) based on BA.2 frequency and growth advantage. B) National critical care bed occupancy in 2 scenarios depending on baseline transmission increase. CIs are calculated from that of the frequency and growth advantage of BA.2 (Figure 5, panel B). The vertical blue line indicates the day the model was performed, the dark blue dots the data, and the shaded areas the 95% range of the model simulations. The 2 scenarios differ according to the capping of the increase of the baseline transmission rate, mimicking either a limited (green) or a strong (blue) easing preventive measures in March 2022 in France. Red open circles indicate data collected after the scenarios were modeled (i.e., not used in the inference or the modeling). The vertical yellow line indicated the last day the data were collected for the figure. Appendix 1 further details model.

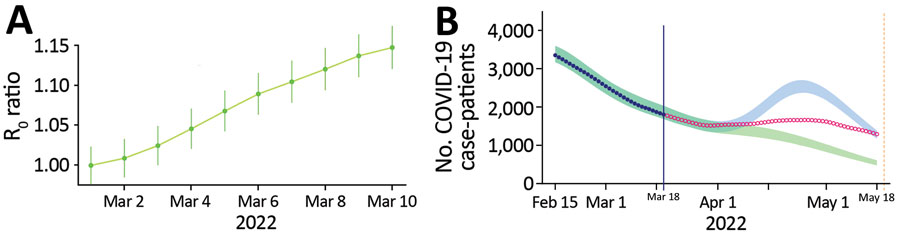
Figure 7. Analyzing and modeling the SARS-CoV-2 Omicron BA.2 epidemic wave in France. A) Ratio between the predicted and observed reproduction number (R0) based on BA.2 frequency and growth advantage. B) National critical care bed occupancy in 2 scenarios depending on baseline transmission increase. CIs are calculated from that of the frequency and growth advantage of BA.2 (Figure 5, panel B). The vertical blue line indicates the day the model was performed, the dark blue dots the data, and the shaded areas the 95% range of the model simulations. The 2 scenarios differ according to the capping of the increase of the baseline transmission rate, mimicking either a limited (green) or a strong (blue) easing preventive measures in March 2022 in France. Red open circles indicate data collected after the scenarios were modeled (i.e., not used in the inference or the modeling). The vertical yellow line indicated the last day the data were collected for the figure. Appendix 1 further details model.

Main Article

Page created: May 03, 2022
Page updated: June 18, 2022
Page reviewed: June 18, 2022
The conclusions, findings, and opinions expressed by authors contributing to this journal do not necessarily reflect the official position of the U.S. Department of Health and Human Services, the Public Health Service, the Centers for Disease Control and Prevention, or the authors' affiliated institutions. Use of trade names is for identification only and does not imply endorsement by any of the groups named above.
file_external