Skip directly to site content Skip directly to page options Skip directly to A-Z link Skip directly to A-Z link Skip directly to A-Z link
Volume 28, Number 9—September 2022
Dispatch

Evaluation of Effectiveness of Global COVID-19 Vaccination Campaign

Daihai He1, Sheikh Taslim Ali1, Guihong Fan, Daozhou Gao, Haitao Song, Yijun Lou, Shi Zhao, Benjamin J. Cowling, and Lewi StoneComments to Author 
Author affiliations: The Hong Kong Polytechnic University, Hong Kong, China (D. He, Y. Lou); The University of Hong Kong, Hong Konga (S.T. Ali, B.J. Cowling); The Laboratory of Data Discovery for Health, Hong Kong Science and Technology Park, Hong Kong (S.T. Ali, B.J. Cowling); Columbus State University, Columbus, Georgia, USA (G. Fan); Shanghai Normal University, Shanghai, China (D. Gao); Shanxi University, Taiyuan, China (H. Song); Chinese University of Hong Kong, Hong Kong, China (S. Zhao); RMIT University, Melbourne, Victoria, Australia and Tel Aviv University, Tel Aviv, Israel (L. Stone)

Main Article

Figure

Deaths averted because of vaccination according to a model used to evaluate effectiveness of global COVID-19 vaccination campaign. The graph represents the difference in total deaths under the counterfactual scenario (without vaccination) and under the baseline scenario (with vaccination) as a percentage of the population. We compared 5 counterfactual scenarios under without-vaccination in which we set the transmission rates after April 16, 2021, to reduce by 0, 10%, 15%, 20%, and 50% compared with the baseline scenario. The y-axis 0.3% means 3 persons per 1,000 population were saved from COVID-19–related death because of vaccination. The absolute value of negative deaths averted results from substantial reduction in transmission rate, rather than vaccination. β(t), time-varying transmission rate; BRA, Brazil; CAN, Canada; COL, Colombia; DEU, Germany; ESP, Spain; FRA, France; GBR, Great Britain (United Kingdom); IND, India; ITA, Italy; MEX, Mexico; RUS, Russia; USA, United States.

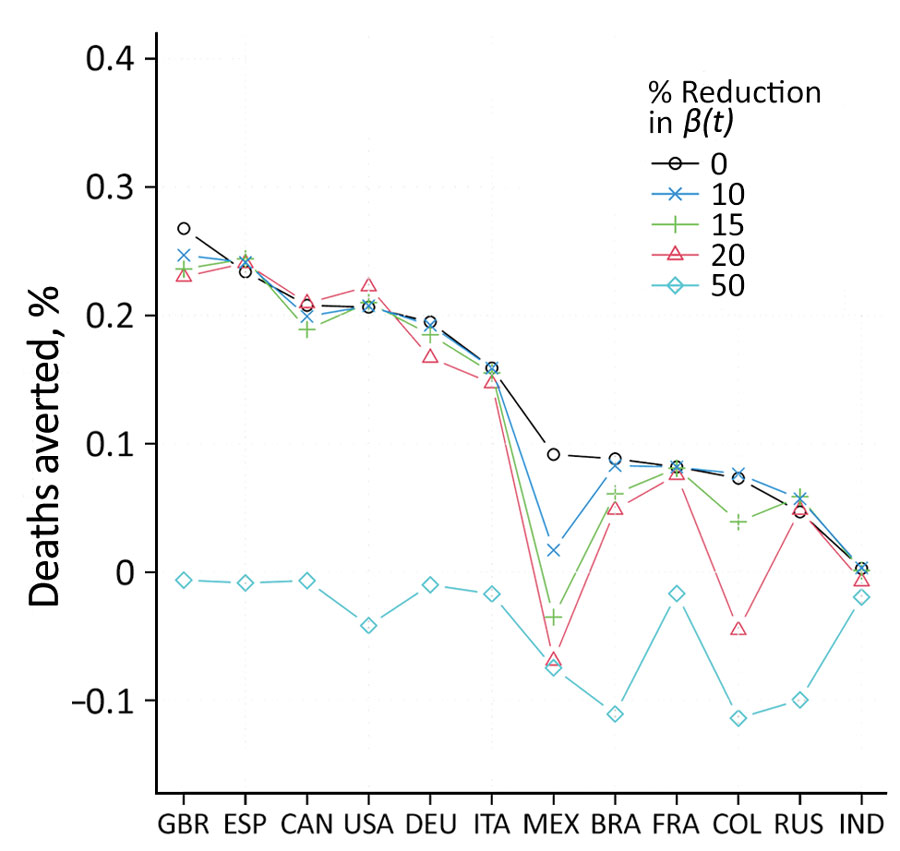
Figure. Deaths averted because of vaccination according to a model used to evaluate effectiveness of global COVID-19 vaccination campaign. The graph represents the difference in total deaths under the counterfactual scenario (without vaccination) and under the baseline scenario (with vaccination) as a percentage of the population. We compared 5 counterfactual scenarios under without-vaccination in which we set the transmission rates after April 16, 2021, to reduce by 0, 10%, 15%, 20%, and 50% compared with the baseline scenario. The y-axis 0.3% means 3 persons per 1,000 population were saved from COVID-19–related death because of vaccination. The absolute value of negative deaths averted results from substantial reduction in transmission rate, rather than vaccination. β(t), time-varying transmission rate; BRA, Brazil; CAN, Canada; COL, Colombia; DEU, Germany; ESP, Spain; FRA, France; GBR, Great Britain (United Kingdom); IND, India; ITA, Italy; MEX, Mexico; RUS, Russia; USA, United States.

Main Article

1These authors contributed equally to this work.

Page created: July 14, 2022
Page updated: August 19, 2022
Page reviewed: August 19, 2022
The conclusions, findings, and opinions expressed by authors contributing to this journal do not necessarily reflect the official position of the U.S. Department of Health and Human Services, the Public Health Service, the Centers for Disease Control and Prevention, or the authors' affiliated institutions. Use of trade names is for identification only and does not imply endorsement by any of the groups named above.
file_external