Longitudinal SARS-CoV-2 Nucleocapsid Antibody Kinetics, Seroreversion, and Implications for Seroepidemiologic Studies
Michael Loesche
1, Elizabeth W. Karlson
1, Opeyemi Talabi, Guohai Zhou, Natalie Boutin, Rachel Atchley, Gideon Loevinsohn, Jun Bai Park Chang, Mohammad A. Hasdianda, Adetoun Okenla, Elizabeth Sampson, Haley Schram, Karen Magsipoc, Kirsten Goodman, Lauren Donahue, Maureen MacGowan, Lewis A. Novack, Petr Jarolim, Lindsey R. Baden
2, and Eric J. Nilles
2
Author affiliations: Brigham and Womens Hospital, Boston, Massachusetts, USA (M. Loesche, E.W. Karlson, O. Talabi, G. Zhou, N. Boutin, R. Atchley, G. Loevinsohn, J.B.P. Chang, M.A. Hasdianda, A. Okenla, E. Sampson, H. Schram, K. Magsipoc, K. Goodman, L. Donahue, M. MacGowan, L.A. Novak, P. Jarolim, L.R. Baden, E.J. Nilles); Massachusetts General Hospital, Boston (M. Loesche, G. Loevinsohn); Harvard Medical School, Boston (E.W. Karlson, G. Zhou, M.A. Hasdianda, P. Jarolim, L.R. Baden, E.J. Nilles); Harvard Humanitarian Initiative, Cambridge, Massachusetts, USA (E.J. Nilles)
Main Article
Figure 1
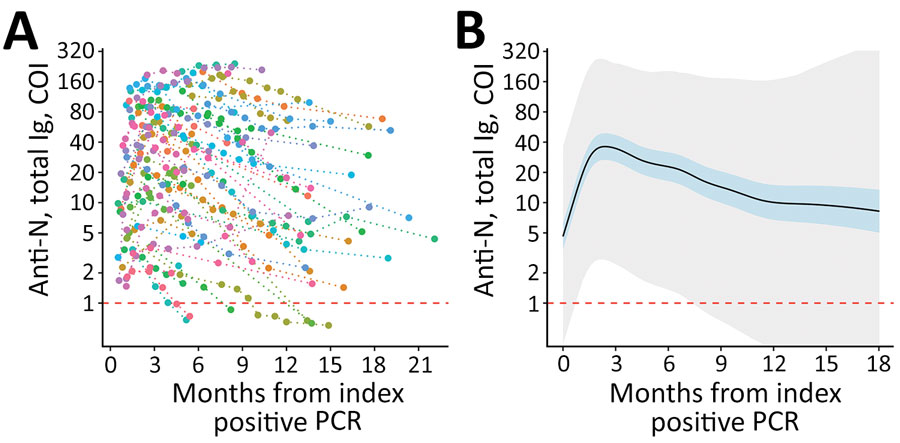
Figure 1. Longitudinal SARS-CoV-2 anti-N total immunoglobulin kinetics among SARS-CoV-2 PCR-positive participants in a study of healthcare workers in Boston, Massachusetts, USA, 2020). A) Individual study participant (n = 74) total anti-N levels from time of index PCR-positive test result. Individual levels are indicated by colored points connected by a dotted line. B) Fitted generalized additive mixed-effect model depicting estimate (solid black line), 95% CI (blue shaded area), and 95% prediction interval (gray shaded area). Estimates are truncated at 18 months given sparsity of later data points. Horizontal dashed red lines indicate the COI for seropositive (above) and seronegative (below) results. The lower limits of detection (COI 0.07) are outside the figure frame. Anti-N, nucleocapsid antibodies; COI, cutoff index.
Main Article
Page created: June 09, 2022
Page updated: August 19, 2022
Page reviewed: August 19, 2022
The conclusions, findings, and opinions expressed by authors contributing to this journal do not necessarily reflect the official position of the U.S. Department of Health and Human Services, the Public Health Service, the Centers for Disease Control and Prevention, or the authors' affiliated institutions. Use of trade names is for identification only and does not imply endorsement by any of the groups named above.