Combined Phylogeographic Analyses and Epidemiologic Contact Tracing to Characterize Atypically Pathogenic Avian Influenza (H3N1) Epidemic, Belgium, 2019
Steven Van Borm
1
, Géraldine Boseret
1, Simon Dellicour
1, Mieke Steensels, Virginie Roupie, Frank Vandenbussche, Elisabeth Mathijs, Aline Vilain, Michèle Driesen, Marc Dispas, Andy W. Delcloo, Philippe Lemey, Ingeborg Mertens, Marius Gilbert, Bénédicte Lambrecht, and Thierry van den Berg
Author affiliations: Sciensano, Brussels, Belgium (S. Van Borm, G. Boseret, M. Steensels, V. Roupie, F. Vandenbussche, E. Mathijs, A. Vilain, M. Driesen, M. Dispas, B. Lambrecht, T. van den Berg); Rega Institute KU Leuven, Leuven, Belgium (S. Dellicour, P. Lemey); Université Libre de Bruxelles, Brussels (S. Dellicour, M. Gilbert); Royal Meteorological Institute of Belgium, Uccle, Belgium (A.W. Delcloo); Federal Agency for the Safety of the Food Chain, Brussels (I. Mertens)
Main Article
Figure 2
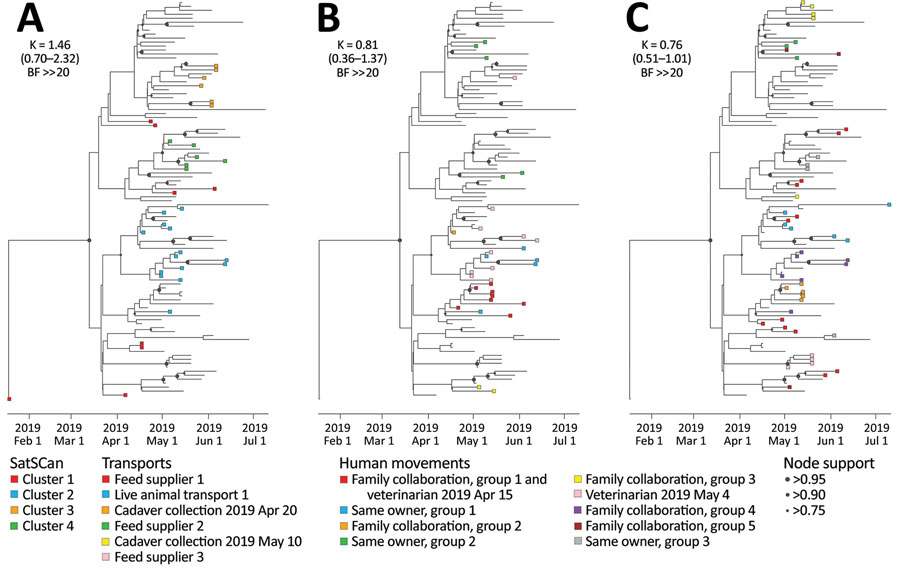
Figure 2. Analysis of the phylogenetic signal associated with 3 covariates in study combining phylogeographic analyses and epidemiologic contact tracing to characterize the atypically pathogenic avian influenza (H3N1) epidemic, Belgium, 2019. We assessed the phylogenetic signal associated with 3 covariates: A) Spatiotemporal SaTScan clusters (https://www.SaTScan.org); B) transport contact networks; C) social contact networks. Tree tip nodes are colored on the basis of the cluster or network to which they belong. For each covariate, we also report the estimated Blomberg K statistic and associated 95% highest posterior density interval (in parentheses) and BF support. BF, Bayes factor; ≫, much greater than.
Main Article
Page created: December 19, 2022
Page updated: January 21, 2023
Page reviewed: January 21, 2023
The conclusions, findings, and opinions expressed by authors contributing to this journal do not necessarily reflect the official position of the U.S. Department of Health and Human Services, the Public Health Service, the Centers for Disease Control and Prevention, or the authors' affiliated institutions. Use of trade names is for identification only and does not imply endorsement by any of the groups named above.