Extended Viral Shedding of MERS-CoV Clade B Virus in Llamas Compared with African Clade C Strain
Jordi Rodon, Anna Z. Mykytyn, Nigeer Te
1, Nisreen M.A. Okba, Mart M. Lamers, Lola Pailler-García, Guillermo Cantero, Irina Albulescu, Berend-Jan Bosch, Malik Peiris, Albert Bensaid, Júlia Vergara-Alert, Bart L. Haagmans

, and Joaquim Segalés
Author affiliations: Unitat Mixta d'Investigació IRTA-UAB en Sanitat Animal, Centre de Recerca en Sanitat Animal (CReSA), Campus de la Universitat Autònoma de Barcelona, Bellaterra, Spain (J. Rodon, N. Te, L. Pailler-García, G. Cantero, A. Bensaid, J. Vergara-Alert, J. Segalés); IRTA, Programa de Sanitat Animal, CReSA, Campus de la Universitat Autònoma de Barcelona, Bellaterra (J. Rodon, N. Te, L. Pailler-García, G. Cantero, A. Bensaid, J. Vergara-Alert); Erasmus Medical Centre, Rotterdam, the Netherlands (A.Z. Mykytyn, N.M.A. Okba, M.M. Lamers, B.L. Haagmans); Utrecht University, Utrecht, the Netherlands (I. Albulescu, B.-J. Bosch); The University of Hong Kong, Hong Kong, China (M. Peiris); Facultat de Veterinària, Universitat Autònoma de Barcelona, Bellaterra (J. Segalés)
Main Article
Figure 2
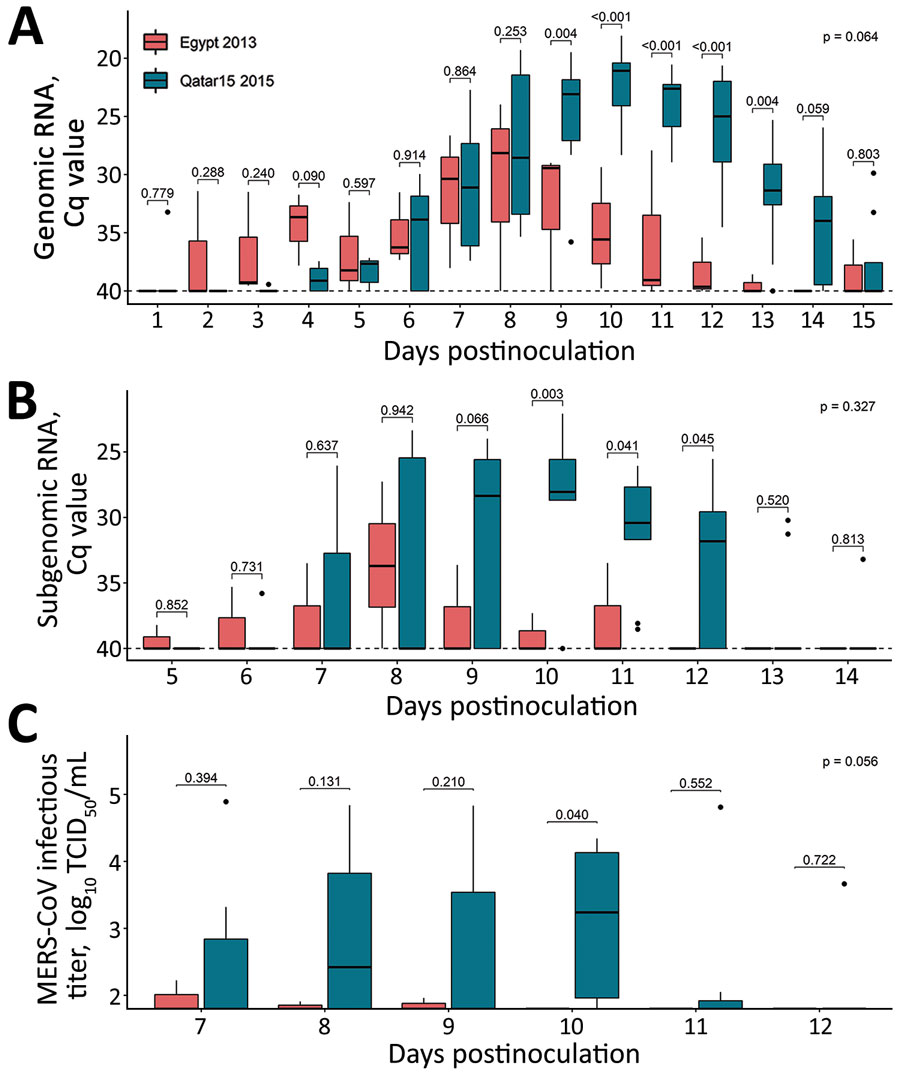
Figure 2. Mixed model analyzing the transmission competence of each MERS-CoV strain over time in investigation of llamas experimentally infected with MERS-CoV. Boxplots show daily virus shedding of sentinel llamas infected with MERS-CoV Egypt/2013 (red) or Qatar15/2015 strains (blue) after direct exposure to inoculated llamas. A, B) Genomic (A) and subgenomic (B) viral RNA quantification in nasal swabs collected throughout the study. C) Infectious MERS-CoV titers. Only the time points considered in the mixed models are represented. Horizontal lines within boxes indicate medians; box tops and bottoms indicate interquartile ranges; error bars indicate 95% CIs; black dots indicate outliers. p values are indicated above the boxes; p values indicate statistical differences between areas under the curve of the experimental groups, as calculated by Wilcoxon test. Cq, quantification cycle; MERS-CoV, Middle East respiratory syndrome coronavirus; TCID50, 50% tissue culture infective dose.
Main Article
Page created: January 04, 2023
Page updated: February 20, 2023
Page reviewed: February 20, 2023
The conclusions, findings, and opinions expressed by authors contributing to this journal do not necessarily reflect the official position of the U.S. Department of Health and Human Services, the Public Health Service, the Centers for Disease Control and Prevention, or the authors' affiliated institutions. Use of trade names is for identification only and does not imply endorsement by any of the groups named above.