Monitoring Temporal Changes in SARS-CoV-2 Spike Antibody Levels and Variant-Specific Risk for Infection, Dominican Republic, March 2021–August 2022
Eric J. Nilles

, Michael de St. Aubin, Devan Dumas, William Duke, Marie Caroline Etienne, Gabriela Abdalla, Petr Jarolim, Timothy Oasan, Salome Garnier, Naomi Iihoshi, Beatriz Lopez, Lucia de la Cruz, Yosanly Cornelio Puello, Margaret Baldwin, Kathryn W. Roberts, Farah Peña, Kara Durski, Isaac Miguel Sanchez, Sarah M. Gunter, Alexander R. Kneubehl, Kristy O. Murray, Allison Lino, Sarah Strobel, Amado Alejandro Baez, Colleen L. Lau, Adam Kucharski, Emily Zielinski Gutiérrez, Ronald Skewes-Ramm, Marietta Vasquez
1, and Cecilia Then Paulino
1
Author affiliations: Brigham and Women’s Hospital, Boston, Massachusetts, USA (E.J. Nilles, M. de St. Aubin, D. Dumas, M.C. Etienne, G. Abdalla, P. Jarolim, T. Oasan, S. Garnier, N. Iihoshi, M. Baldwin, K.W. Roberts, K. Durski); Harvard Humanitarian Initiative, Cambridge, Massachusetts, USA (E.J. Nilles, M. de St. Aubin, D. Dumas, S. Garnier, M. Baldwin, K.W. Roberts, K. Durski); Harvard Medical School, Boston (E.J. Nilles, P. Jarolim); Pedro Henríquez Ureña National University, Santo Domingo, Dominican Republic (W. Duke); US Centers for Disease Control and Prevention, Central America Regional Office, Guatemala City, Guatemala (B. Lopez, E. Zielinski Gutiérrez); Ministry of Health and Social Assistance, Santo Domingo (L. de la Cruz, Y. Cornelio Puello, F. Peña, I.M. Sanchez, R. Skewes-Ramm, C. Then Paulino); Baylor College of Medicine and Texas Children’s Hospital, Houston, Texas, USA (S.M. Gunter, A.R. Kneubehl, K.O. Murray, A. Lino, S. Strobel); Dominican Republic Office of the Presidency, Santo Domingo (A.A. Baez); University of Queensland, Brisbane, Queensland, Australia (C.L. Lau); London School of Hygiene and Tropical Medicine, London, England, UK (A. Kucharski); Yale School of Medicine, New Haven, Connecticut, USA (M. Vasquez)
Main Article
Figure 2
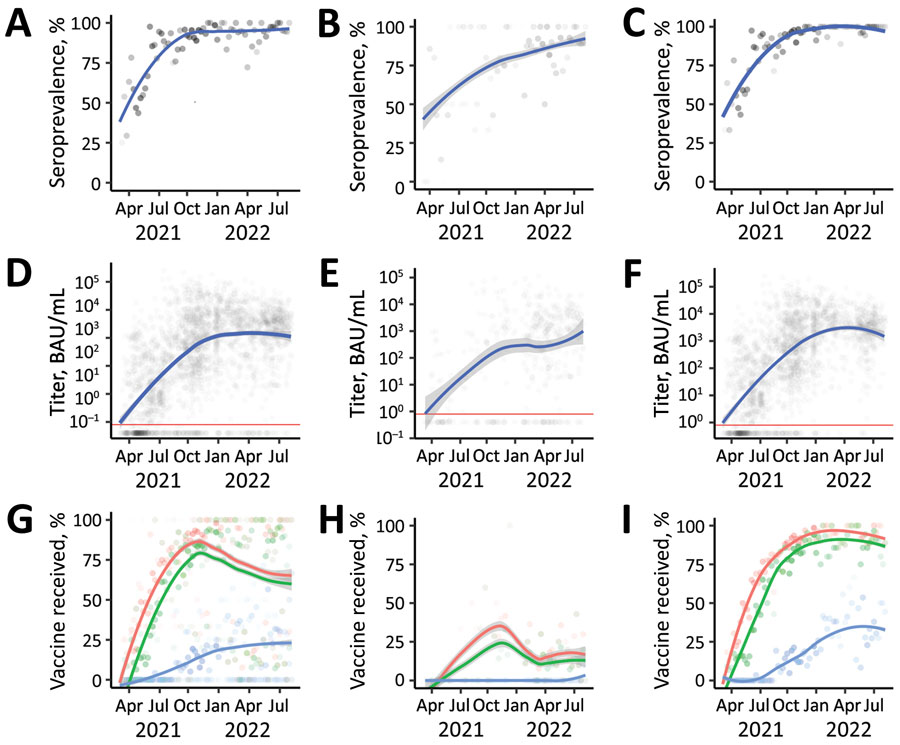
Figure 2. SARS-CoV-2 S antibody seroprevalence, titers, and vaccine doses of participants enrolled (N = 2,300) in a study of SARS-CoV-2 S antibody levels, by age group, Dominican Republic, March 2021–May 2022. A–C) Seroprevalence among study participants of all ages (A), 2–17 years of age (B), and >18 years of age (C). Gray dots indicate weekly mean values; increased dot intensity reflected more observations. Blue line indicates locally estimated scatterplot smoothing (LOESS) smoothed seroprevalence; gray shading indicates 95% CI around the smoothed estimate. D–F) Titers among study participants of all ages (D), 2–17 years of age (E), and >18 years of age (F), by week, plotted on a log scale. Each gray dot indicates a unique study participant (n = 1,910). Blue lines indicate LOESS smoothed antibody levels; gray shading indicates 95% CI around the smoothed estimate. Horizontal red line indicates manufacturer recommended cutoff index (>0.800 BAU /mL); values above the line represent a positive result and values below the line a negative result. G–I) Percentage of weekly enrolled participants of all ages (G), 2–17 years of age (H), and >18 years of age (I) who had received >1 (red dots), >2 (green dots), or >3 (blue dots) COVID-19 vaccine doses; increased dot intensity reflects more observations. Colored lines indicate LOESS smoothed percentage; gray shading indicates 95% CI around smoothed percentage. BAU, binding antibody units; S, spike.
Main Article
Page created: January 17, 2023
Page updated: March 20, 2023
Page reviewed: March 20, 2023
The conclusions, findings, and opinions expressed by authors contributing to this journal do not necessarily reflect the official position of the U.S. Department of Health and Human Services, the Public Health Service, the Centers for Disease Control and Prevention, or the authors' affiliated institutions. Use of trade names is for identification only and does not imply endorsement by any of the groups named above.