Monitoring Temporal Changes in SARS-CoV-2 Spike Antibody Levels and Variant-Specific Risk for Infection, Dominican Republic, March 2021–August 2022
Eric J. Nilles

, Michael de St. Aubin, Devan Dumas, William Duke, Marie Caroline Etienne, Gabriela Abdalla, Petr Jarolim, Timothy Oasan, Salome Garnier, Naomi Iihoshi, Beatriz Lopez, Lucia de la Cruz, Yosanly Cornelio Puello, Margaret Baldwin, Kathryn W. Roberts, Farah Peña, Kara Durski, Isaac Miguel Sanchez, Sarah M. Gunter, Alexander R. Kneubehl, Kristy O. Murray, Allison Lino, Sarah Strobel, Amado Alejandro Baez, Colleen L. Lau, Adam Kucharski, Emily Zielinski Gutiérrez, Ronald Skewes-Ramm, Marietta Vasquez
1, and Cecilia Then Paulino
1
Author affiliations: Brigham and Women’s Hospital, Boston, Massachusetts, USA (E.J. Nilles, M. de St. Aubin, D. Dumas, M.C. Etienne, G. Abdalla, P. Jarolim, T. Oasan, S. Garnier, N. Iihoshi, M. Baldwin, K.W. Roberts, K. Durski); Harvard Humanitarian Initiative, Cambridge, Massachusetts, USA (E.J. Nilles, M. de St. Aubin, D. Dumas, S. Garnier, M. Baldwin, K.W. Roberts, K. Durski); Harvard Medical School, Boston (E.J. Nilles, P. Jarolim); Pedro Henríquez Ureña National University, Santo Domingo, Dominican Republic (W. Duke); US Centers for Disease Control and Prevention, Central America Regional Office, Guatemala City, Guatemala (B. Lopez, E. Zielinski Gutiérrez); Ministry of Health and Social Assistance, Santo Domingo (L. de la Cruz, Y. Cornelio Puello, F. Peña, I.M. Sanchez, R. Skewes-Ramm, C. Then Paulino); Baylor College of Medicine and Texas Children’s Hospital, Houston, Texas, USA (S.M. Gunter, A.R. Kneubehl, K.O. Murray, A. Lino, S. Strobel); Dominican Republic Office of the Presidency, Santo Domingo (A.A. Baez); University of Queensland, Brisbane, Queensland, Australia (C.L. Lau); London School of Hygiene and Tropical Medicine, London, England, UK (A. Kucharski); Yale School of Medicine, New Haven, Connecticut, USA (M. Vasquez)
Main Article
Figure 3
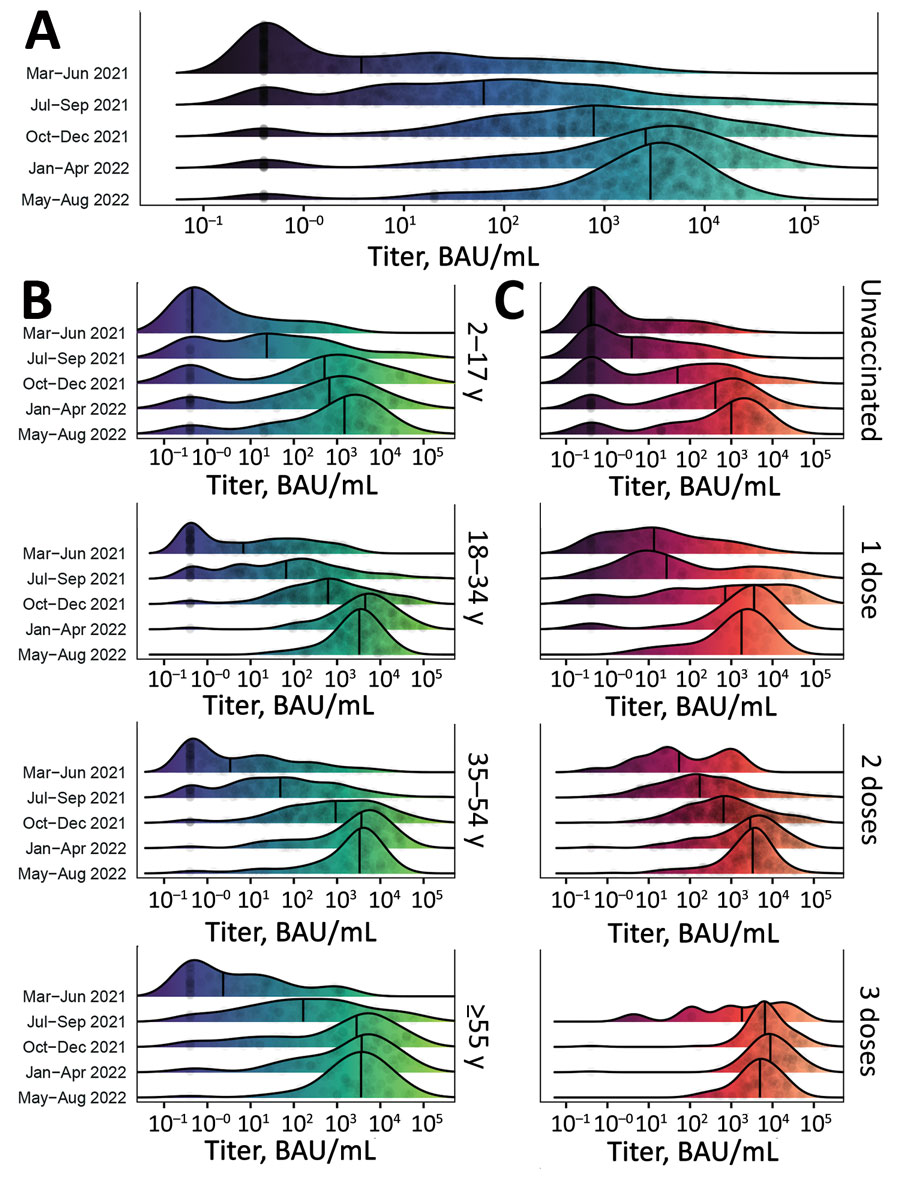
Figure 3. Distribution of SARS-CoV-2 S antibody titers among participants in a study of SARS-CoV-2 S antibody levels, Dominican Republic, March 2021–August 2022. A) Smoothed density plot demonstrates log-adjusted distribution of anti-S antibody titers among all study participants (N = 2,300), stratified by date interval when study participants were enrolled from earliest (March–June 2021, upper) to latest (May–August 2022, lower). Study interval labels indicate complete months except March 2021, which represents enrollment starting March 22, 2021, and August 2022, which represents enrollment through August 17, 2022. B) Smoothed density plot demonstrates log-adjusted distribution of S antibody titers among study participants (n = 2,300) stratified by age group. Dark purple shading indicates lower S titers and light green higher titers. C) Smoothed density plot demonstrates log-adjusted distribution of S antibody titers among participants (n = 2,293), stratified by number of COVID-19 vaccine doses received from none (unvaccinated, top plot) to 3 (bottom plot). Darker red shading indicates lower S titers and light orange higher titers. Six participants who received 4 COVID-19 vaccine doses not included. Values for 3 vaccine doses for March–June 2021 period plot not shown given sparsity of datapoints (n = 1). For all plots, gray circles represent titer adjusted individual study participant values. Narrow vertical black lines indicates median values. Lower limit of assay measurement is 0.4 BAU/mL, and values <0.4 BAU/mL are represented as 0.4 BAU/mL, with smoothing extending curves below the lower measurement limit. Therefore, density plot shading is used for illustrative purposes. Table 2 and Appendix Tables 2, 3) summarize data used for plots. BAU, binding antibody units; S, spike.
Main Article
Page created: January 17, 2023
Page updated: March 20, 2023
Page reviewed: March 20, 2023
The conclusions, findings, and opinions expressed by authors contributing to this journal do not necessarily reflect the official position of the U.S. Department of Health and Human Services, the Public Health Service, the Centers for Disease Control and Prevention, or the authors' affiliated institutions. Use of trade names is for identification only and does not imply endorsement by any of the groups named above.