Volume 29, Number 7—July 2023
Dispatch
Estimates of Serial Interval and Reproduction Number of Sudan Virus, Uganda, August–November 2022
Abstract
We estimated the mean serial interval for Sudan virus in Uganda to be 11.7 days (95 CI% 8.2–15.8 days). Estimates for the 2022 outbreak indicate a mean basic reproduction number of 2.4–2.7 (95% CI 1.7–3.5). Estimated net reproduction numbers across districts suggest a marked spatial heterogeneity.
Figure 1
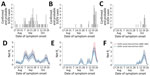
Figure 1. Epidemic curves and reproduction numbers for SUDV outbreaks in Mubende, Kassanda, and Kampala districts, Uganda, August–November 2022. A–C) Number of confirmed and probable cases by date of symptom onset in...
On September 20, 2022, Uganda’s Ministry of Health declared an Ebola disease outbreak after a case caused by Sudan virus (SUDV) was confirmed in a village in Mubende District (1). Suspicious deaths in the same district had occurred earlier in the month. Investigations conducted by the National Rapid Response Team allowed the identification of probable SUDV cases dating back to mid-August 2022 (2,3). As of November 2, 2022, a total of 149 cases (131 PCR-confirmed and 18 probable) were reported in the country; most cases occurred in the districts of Mubende (63 confirmed, 17 probable), Kassanda (42 confirmed, 1 probable), and Kampala (18 confirmed) (2) (Figure 1, panels A–C). On January 11, 2023, the outbreak was declared over with a total of 164 cases (142 confirmed, 22 probable) (4).
We provide 2 estimates of the serial interval distribution (the time elapsed between the symptom onset in an index case-patient and in their secondary case-patients) by using observed serial intervals in infector–infectee pairs as identified during contact-tracing operations conducted in 2 SUDV outbreaks in Uganda, during 2000–2001 (24 pairs) (5) and the 2022 outbreak (12 pairs) (6). We fitted 3 families of distributions (Weibull, Gamma, and log-normal) with a possible offset (5,6). We obtained the best fit for the serial interval distribution for both datasets with a Weibull distribution. We estimated the mean serial interval to be 12.0 days (95% CI 10.0–14.2 days) by using the 2000–2001 outbreak data and 11.7 days (95% CI 8.2–15.8 days) by using the 2022 outbreak data.
We then used estimates of the serial interval as a proxy of the generation time to compute the basic (R0) and net (Rt) reproduction numbers. We defined R0 as the average number of secondary infections generated by an infectious person in a fully susceptible population. If R0 <1, transmission is expected to fade out, whereas if R0 >1, the epidemic has the potential to continue; the larger R0, the more difficult it is to control the epidemic. We defined Rt as the average number of secondary cases per infectious person at time t; Rt is key to monitor the effectiveness of interventions throughout the epidemic. In the main analysis, we computed Rt and R0 by using a method based on the renewal equation in the formulation by Cori et al. (7). In additional analyses, we used the assumption of exponential (8) or subexponential (9) growth of the cumulative case incidence curve to compute R0. We also provided an alternative estimate of Rt obtained by applying a recently proposed approach (10) that has been suggested to perform better with low case counts (Appendix).
R0 of the 2022 outbreak, as estimated from the epidemic curve of Mubende District, was 2.7 (95% CI 1.9–3.5) based on the serial interval distribution from the 2000–2001 outbreak. R0 was 2.4 (95% CI 1.7–3.3) based on the serial interval distribution from the 2022 outbreak.
We estimated Rt in the 3 districts and according to the 2 estimated serial interval distributions (Figure 1, panels D–F). For convenience and given their similar values, numbers reported hereafter refer to the 2000–2001 serial interval; corresponding numbers for the 2022 serial interval are reported separately (Appendix). In Mubende District, Rt reached a peak during September 21–23, 2022, with an estimated value for Rt that was close to R0 (mean 2.4 [95% CI 1.5–3.5]). Rt fell rapidly below the epidemic threshold during September 28–October 15 (mean 0.71 [95% CI 0.50–0.91]), possibly because of control interventions and population behavior changes after awareness of the outbreak had increased. In the second half of October, Rt increased again, reaching a peak of 1.34 (95% CI 0.78–2.13) in the week October 18–24. In the districts of Kassanda and Kampala, Rt increased rapidly in the second half of October. In Kassanda, Rt reached a peak of 3.5 (95% CI 2.5–4.9) during October 20–24. In Kampala, the peak Rt value was 2.0 (95% CI 1.3–3.2) during October 18–22.
Figure 2
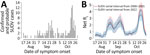
Figure 2. Epidemic curves and reproduction number for SUDV outbreaks, Uganda, August–November 2022. A) Number of confirmed and probable cases, by date of symptom onset, in Uganda as obtained from district-level epidemic...
Estimates of Rt at the national level (Figure 2) are characterized by 2 peaks in September, which were driven by SUDV transmission in Mubende. A third marked peak that occurred in the second half of October was sustained mainly by increasing transmission in the districts of Kassanda and Kampala, as well as by a resurgence in Mubende.
We estimated the distribution of the serial intervals for SUDV by using 2 different datasets from the 2000–2001 outbreak and from the ongoing outbreak in Uganda, finding similar distributions and an average serial interval of ≈12 days. On the basis of those estimates and publicly available data on the epidemic curve made available by the Ugandan Ministry of Health (2), we found the R0 in Mubende District, the district first and most affected by the current outbreak, was ≈2.4–2.7, although with broad uncertainty (95% CI 1.7–3.5). Those estimates are in line with previous estimates for SUDV, which ranged from 1.3 to 4.1 (11), and with estimates obtained using alternative methods (8,9) (Appendix). After a temporary containment of the outbreak from the end of September until mid-October 2022, with Rt hovering around 0.7, the third week of October marked a resurgence of transmissibility in Mubende (Rt ≈1.3) and the emergence of new outbreaks in the Kassanda (Rt ≈3.5) and Kampala (Rt ≈2.0) districts. The R0 associated with the national aggregation shows the same temporal features but suggests even higher numbers for the R0 in the fourth week of October (mean R0 ≈4), demonstrating the important role played by spatial heterogeneity of transmission in the 2022 outbreak.
Our estimates should be interpreted with caution, considering the following limitations. Estimates of the serial interval distributions are based on small numbers of infector–infectee pairs. Reproduction numbers have a broad uncertainty because of limited case numbers and may be substantially affected by superspreading events, biasing estimate upward with respect to the average transmissibility in the general population. However, the proposed estimates are in line with those obtained using an alternative method that was suggested to be more robust for low case counts (10) (Appendix). Moreover, a potential increase in reporting rates of confirmed cases after the discovery of the first cases in each district may inflate the estimate of the reproduction numbers.
Given the geographic expansion of the outbreak, which included urban settings, and the absence of therapeutics and licensed vaccines to treat and prevent SUDV, by the end of October 2022, the World Health Organization assessed the risk for infection at the national level to be very high (12). However, the rapid deployment of interventions (including contact tracing, isolation of case-patients, and informational activities to promote community engagement) was sufficient to contain the outbreak, which was declared over on January 11, 2023. Our analysis provides quantitative information on the evolution of SUDV transmissibility in the different districts of Uganda during the 2022 outbreak. Estimates provided for the serial interval may be instrumental in planning control interventions in possible future outbreaks of SUDV.
Dr. Marziano is a researcher at the Bruno Kessler Foundation in Trento, Italy. Her primary research interests are mathematical models to investigate the epidemiology of infectious diseases, support public health decisions, and assess the effectiveness of interventions.
Acknowledgment
This research was supported by European Union funding within the NextGeneration EU-MUR PNRR Extended Partnership initiative on Emerging Infectious Diseases (project no. PE00000007, INF-ACT). The funders had no role in study design, data collection and analysis, decision to publish, or preparation of the manuscript.
References
- World Health Organization–Uganda. Uganda declares Ebola virus disease outbreak. 2022 [cited 2023 Jun 6]. https://www.afro.who.int/countries/uganda/news/uganda-declares-ebola-virus-disease-outbreak
- Republic of Uganda Ministry of Health, World Health Organization–Uganda. Ebola virus disease—situation report 42 [cited 2023 Jun 6]. https://www.afro.who.int/sites/default/files/2022-11/Ug_EVD_SitRep%2342.pdf
- European Centre for Disease Prevention and Control. Ebola disease outbreak caused by Sudan ebolavirus in Uganda, 2022—9 November 2022 [cited 2023 Jun 6]. https://www.ecdc.europa.eu/sites/default/files/documents/ebola-risk-sudan-virus-considered-very-low-risk-assessment.pdf
- Republic of Uganda Ministry of Health, World Health Organization–Uganda. Ebola virus disease—situation report 93 [cited 2023 Jun 6]. https://www.afro.who.int/sites/default/files/2023-01/Ug_EVD_SitRep%2393.pdf
- Francesconi P, Yoti Z, Declich S, Onek PA, Fabiani M, Olango J, et al. Ebola hemorrhagic fever transmission and risk factors of contacts, Uganda. Emerg Infect Dis. 2003;9:1430–7. DOIPubMedGoogle Scholar
- Republic of Uganda Ministry of Health. Press statement. Update on the Ebola virus disease outbreak and containment measures. 26 October, 2022 [cited 2023 Jun 6]. https://www.health.go.ug/cause/update-on-the-ebola-virus-disease-outbreak-and-containment-measures
- Cori A, Ferguson NM, Fraser C, Cauchemez S. A new framework and software to estimate time-varying reproduction numbers during epidemics. Am J Epidemiol. 2013;178:1505–12. DOIPubMedGoogle Scholar
- Chowell G, Hengartner NW, Castillo-Chavez C, Fenimore PW, Hyman JM. The basic reproductive number of Ebola and the effects of public health measures: the cases of Congo and Uganda. J Theor Biol. 2004;229:119–26. DOIPubMedGoogle Scholar
- Chowell G, Viboud C, Simonsen L, Moghadas SM. Characterizing the reproduction number of epidemics with early subexponential growth dynamics. J R Soc Interface. 2016;13:
20160659 . DOIPubMedGoogle Scholar - Parag KV. Improved estimation of time-varying reproduction numbers at low case incidence and between epidemic waves. PLOS Comput Biol. 2021;17:
e1009347 . DOIPubMedGoogle Scholar - Van Kerkhove MD, Bento AI, Mills HL, Ferguson NM, Donnelly CA. A review of epidemiological parameters from Ebola outbreaks to inform early public health decision-making. Sci Data. 2015;2:
150019 . DOIPubMedGoogle Scholar - World Health Organization. Ebola disease caused by Sudan Ebola virus—Uganda. 2022 [cited 2023 Jun 6]. https://www.who.int/emergencies/disease-outbreak-news/item/2022-DON421
Figures
Cite This ArticleOriginal Publication Date: June 09, 2023
Table of Contents – Volume 29, Number 7—July 2023
| EID Search Options |
|---|
|
|
|
|
|
|
Please use the form below to submit correspondence to the authors or contact them at the following address:
Stefano Merler, Center for Health Emergencies, Bruno Kessler Foundation, Via Sommarive 18, 38123, Trento, Italy
Top