Skip directly to site content Skip directly to page options Skip directly to A-Z link Skip directly to A-Z link Skip directly to A-Z link
Volume 8, Number 10—October 2002
THEME ISSUE
Bioterrorism-related Anthrax

Specific, Sensitive, and Quantitative Enzyme-Linked Immunosorbent Assay for Human Immunoglobulin G Antibodies to Anthrax Toxin Protective Antigen

Conrad P. Quinn*Comments to Author , Vera A. Semenova*, Cheryl M. Elie*, Sandra Romero-Steiner*, Carolyn M. Greene*, Han Li*, Karen Stamey*, Evelene Steward-Clark*, Daniel S. Schmidt*, Elizabeth Mothershed*, Janet Pruckler*, Stephanie Schwartz*, Robert F. Benson*, Leta O. Helsel*, Patricia F. Holder*, Scott E. Johnson*, Molly Kellum*, Trudy Messmer*, W. Lanier Thacker*, Lilah Besser*, Brian D. Plikaytis*, Thomas H. Taylor*, Alison E. Freeman*, Kelly J. Wallace*, Peter Dull*, Jim Sejvar*, Erica Bruce*, Rosa Moreno*, Anne Schuchat*, Jairam R. Lingappa*, Sandra K. Martin*, John Walls*, Melinda Bronsdon*, George M. Carlone*, Mary Bajani-Ari*, David A. Ashford*, David S. Stephens*†, and Bradley A. Perkins*
Author affiliations: *Centers for Disease Control and Prevention, Atlanta, Georgia, USA; †Emory University, Atlanta, Georgia, USA;

Main Article

Figure

Graphic representation of minimum detectable concentration (MDC), reliable detection limit (RDL), and reactivity threshold. The MDC is the concentration of anti-protective antigen antibody (anti-PA) corresponding to the interpolated intersection of the lower asymptote of the upper 95% confidence limit of the 4-parameter logistic log fit of the standard curve data. The RDL is the concentration of anti-PA antibody corresponding to the interpolated intersection of the lower asymptote of the upper 95% confidence limit with the lower 95% confidence limit of the standard’s data. The reactivity threshold was determined as the upper 95% confidence limit of the frequency distribution from log10-transformed optical density (OD) values of control human sera tested at 1/50 dilution. This OD value was converted to an anti-PA immunoglobulin (Ig) G concentration by using the standard curve calibration factor. Where this calculated value is below the MDC of the assay, the MDC was selected as the default reactivity threshold.

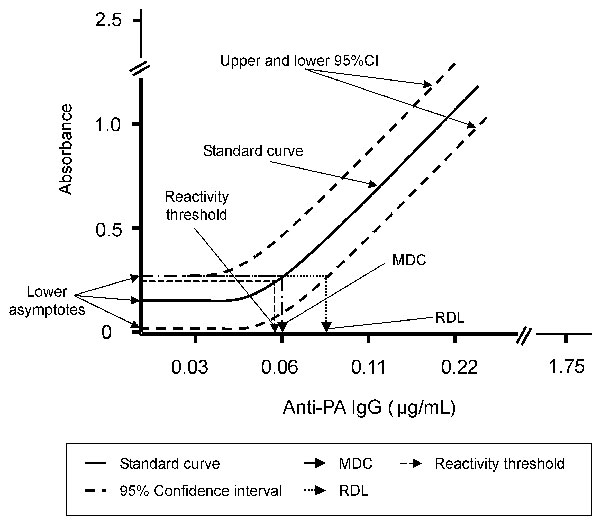
Figure. Graphic representation of minimum detectable concentration (MDC), reliable detection limit (RDL), and reactivity threshold. The MDC is the concentration of anti-protective antigen antibody (anti-PA) corresponding to the interpolated intersection of the lower asymptote of the upper 95% confidence limit of the 4-parameter logistic log fit of the standard curve data. The RDL is the concentration of anti-PA antibody corresponding to the interpolated intersection of the lower asymptote of the upper 95% confidence limit with the lower 95% confidence limit of the standard’s data. The reactivity threshold was determined as the upper 95% confidence limit of the frequency distribution from log10-transformed optical density (OD) values of control human sera tested at 1/50 dilution. This OD value was converted to an anti-PA immunoglobulin (Ig) G concentration by using the standard curve calibration factor. Where this calculated value is below the MDC of the assay, the MDC was selected as the default reactivity threshold.

Main Article

Page created: July 19, 2010
Page updated: July 19, 2010
Page reviewed: July 19, 2010
The conclusions, findings, and opinions expressed by authors contributing to this journal do not necessarily reflect the official position of the U.S. Department of Health and Human Services, the Public Health Service, the Centers for Disease Control and Prevention, or the authors' affiliated institutions. Use of trade names is for identification only and does not imply endorsement by any of the groups named above.
file_external