Volume 8, Number 11—November 2002
THEME ISSUE
Tuberculosis Genotyping
Tuberculosis Genotyping Network, United States
Spoligologos: A Bioinformatic Approach to Displaying and Analyzing Mycobacterium tuberculosis Data
Abstract
Spacer oligonucleotide (spoligotyping) analysis is a rapid polymerase chain reaction–based method of DNA fingerprinting the Mycobacterium tuberculosis complex. We examined spoligotype data using a bioinformatic tool (sequence logo analysis) to elucidate undisclosed phylogenetic relationships and gain insights into the global dissemination of strains of tuberculosis. Logo analysis of spoligotyping data provides a simple way to describe a fingerprint signature and may be useful in categorizing unique spoligotypes patterns as they are discovered. Large databases of DNA fingerprint information, such as those from the U.S. National Tuberculosis Genotyping and Surveillance Network and the European Concerted Action on Tuberculosis, contain information on thousands of strains from diverse regions. The description of related spoligotypes has depended on exhaustive listings of the individual spoligotyping patterns. Logo analysis may become another useful graphic method of visualizing and presenting spoligotyping clusters from these databases.
The process of DNA fingerprinting Mycobacterium tuberculosis isolates provides epidemiologists with data for investigating transmission and confirming laboratory cross-contamination. When personnel and resources are available, strains from all newly diagnosed cases of tuberculosis (TB) are fingerprinted. Interpreting the data from these sentinel surveillance studies can be challenging. TB can be latent for decades before resulting in active disease. The best method for examining M. tuberculosis complex genotyping data gathered over just a few years is still in question.
The genotyping of M. tuberculosis complex has been undertaken in the United States in directed studies and in sentinel surveillance. Since 1992, M. tuberculosis complex DNA fingerprinting for isolates has been available to U.S. Departments of Health and TB Control Offices to investigate cases of suspected TB transmission and suspected laboratory cross-contamination. At the same time, sentinel surveillance of select regions was used to evaluate if genotyping every new patient isolate from a particular region was useful. Although direct DNA fingerprinting studies are relatively simple to design, we are still learning how best to use in toto the large and diverse databases generated by sentinel surveillance studies from multiple laboratories (1–7). Previous studies have used DNA fingerprinting methods to understand the development and spread of subspecies of the M. tuberculosis complex, such as Mycobacterium africanum (8,9), M. bovis (10), and the W-Beijing family (11,12).
Analyzing the spread and evolution of M. tuberculosis complex strains is more complicated because of the long incubation of disease and relatively short-term collection of data (approximately 10 years). We examine whether bioinformatic tools can help in analyzing the data collected. Bioinformatics uses sophisticated analyses of large amounts of genetic information to clarify the relationships between species, explain the evolution of groups of genes, and assemble information from genome sequencing projects. Bioinformatic analysis involves searching nucleic acid or protein sequence information for previously unrecognized motifs that may signal previously unrecognized regions of interest. Spoligotype analysis (13) is a form of DNA sequencing by hybridization. Several groups have used some of these novel analytical tools to examine M. tuberculosis complex genotyping (4,6,14). Sequence logo analysis can find motifs in potentially related nucleic acid or protein sequences (15). Logo analysis combines these data on a graphic that illustrates the location and degree of sequence conservation in the selected sequences. We applied sequence logo analysis to find motifs based on the presence or absence of specific spacer sequences. We also evaluated the usefulness of logo analysis in examining phylogenetic relationships of the M. tuberculosis complex direct repeat (DR) (7) locus and its potential as a simple graphic method presenting grouped spoligotyping data.
We suggest using the sequence logo technique to understand the distribution of each the spacer sequences used in the spoligotype assay. This information is useful in improving or redesigning the spoligotype assay by showing the degree of differentiation achieved with each spacer sequence.
Isolates
Approximately 5,100 isolates of M. tuberculosis complex, predominately from patients in TB control programs in the northeast United States, are part of the Wadsworth Center spoligotype database. Most of these strains have been collected through ongoing sentinel surveillance projects in Massachusetts and New York City from 1996 to the present. In our strain collection, 920 different spoligotype patterns were identified.
DNA Fingerprinting Analyses
Spoligotype analysis was performed according to a standard method (13). PCR amplifications were performed on extracted DNA or cell suspensions, which were heat-killed at 80°C for 1 hr in an oven. Spoligotype patterns were analyzed with BioImage Whole Band Analysis v3.4 software (Genomic Solutions, Ann Arbor, MI) on a Sun Ultra10 workstation (Sun Microsystems Inc., Santa Clara, CA). Spoligotype patterns were given descriptive nomenclature according to the standard method (16), along with a unique arbitrary numeric designation by the Centers for Disease Control and Prevention (CDC).
IS6110-based restriction fragment length polymorphism (RFLP) analysis was performed, according to standard protocol (17), at the Wadsworth Center (Albany, NY) and the Public Health Research Institute (New York City, NY), on approximately 3,700 of these isolates. RFLP patterns were analyzed with BioImage Whole Band Analysis v3.4 software (Genomic Solutions). RFLP pattern designations for sentinel surveillance isolates were assigned a unique arbitrary numerical designation by CDC.
Spoligologo Analysis
Spoligologo denotes the application of sequence logo analysis to spoligotype assay data. Sequence logo analysis was originally devised as a method to find blocks of related amino acids between protein sequences and display the information in an intuitive visual description that illustrates both the residue and the degree of conservation at each position (18). Logo analysis has been used to look for functional and evolutionary relationships among groups of proteins and nucleic acids (19). Spoligologo analysis (15) was accomplished by using WebLogo software from the School of the Biological Sciences at the University of Cambridge (available from: URL: http://www.bio.cam.ac.uk/seqlogo/). To be compatible with WebLogo, letter designations (x=hybridization, o=no hybridization signal) were used to denote the pattern of hybridization observed for each spoligotype pattern. Spoligotype patterns to be compared were entered directly into WebLogo and a postscript file of the results was generated. Logo analysis compares each selected pattern against the other at the same position. Thus, we compared hybridization to spacer 1 in the group of selected spoligotypes, followed by analysis of spacer 2, and so on for all 43 spacers.
For convenience of illustration, two groups of isolates were chosen for spoligologo analysis. The first set consisted of 43 strains of M. bovis (13) in our collection. The second set was 12 low-band (exhibiting fewer than six copies of IS6110 by RFLP analysis) M. tuberculosis isolates from Vietnam-born, Massachusetts sentinel surveillance case-patients. Vietnamese patients are the largest foreign-born group represented in the low-band data from Massachusetts.
Figure 1
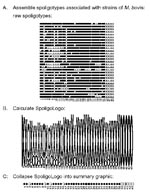
Figure 1. Logo analysis on spoligotypes associated with Mycobacterium bovis. The Wadsworth Center database contains 28 unique spoligotypes from strains of M. bovis. Panel A illustrates the raw hybridization data followed by the...
Figure 1 illustrates logo analysis with spoligotyping data. Spoligotyping identified 28 different spoligotypes associated with M. bovis from 43 isolates in our collection. The spoligotypes were then coded for sequence logo analysis (Figure 1A). Letter designations were chosen for compatibility with the WebLogo program as described in Methods. The tallest x and o characters represent areas of absolute concordance between the patterns chosen for analysis. Where differences occur, the ratio of those spoligotypes showing hybridization to those that do not is represented by relative height differences of the characters in that column. The resulting spoligologo (Figure 1B) shows that spacers 20, 25, 26, and 38 are present in all 28 spoligotype patterns. The absence of spacers 39–43 in these spoligotype patterns is consistent with an identification of M. bovis (13). The greatest polymorphism between the patterns appears in spacers 3 through 16 (Figure 1B). Spoligotype patterns probably evolve through the loss of spacer sequences through a variety of mechanisms (7,20). We try to extrapolate back to the hypothetical founder of these M. bovis isolates, which we believe had spacers 1–38 and not 39–43. No isolate with this probable M. bovis founder spoligotype has yet been observed in the Wadsworth Center spoligotype database.
Figure 2
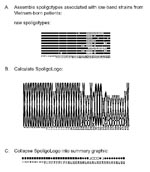
Figure 2. Logo analysis on nine different spoligotypes observed for Mycobacterium tuberculosis isolates from Vietnam-born patients in Massachusetts demonstrating fewer than six copies of IS6110 by RFLP analysis. Legend: x= hybridization observed to...
Foreign-born persons, especially those from regions with high TB case rates, are of concern for TB transmission in the United States (21,22). The low-band M. tuberculosis strains from Vietnam-born patients, which we selected, produced another spoligologo pattern (Figure 2). The ability of spoligologo analysis to collapse even a small selection of spoligotype patterns from a select group of strains (Figure 2A) into the possible founder spoligotype can be observed in the summary (Figure 2C). However, additional typing methods would be required to verify that the strains are related, rather than exhibiting convergent evolution of their respective spoligotypes.
As previously suggested (5,7,23), M. tuberculosis strains that generally contain spacers 33–43 may form a family that is an intermediate lineage between the Beijing (11,12) and non-Beijing M. tuberculosis strain families, such as Haarlem (2).
Spoligotyping, microarrays, and DNA-chips are all examples of reverse-hybridization array-based assays. Although microarrays and DNA-chips can contain thousands of bits of data, the principle behind them is similar to that of the spoligotype assay, which uses a simple 1 x 43 array. Array-based assays use reverse hybridization in which a labeled sample is probed against a series of proteins or nucleic acids that are bound to a solid support, such as a nylon membrane or silica. The result for each potential binding event can be recorded as yes or no. The binary nature of array-based assays allows the data to be analyzed usefully with algorithms associated with motif recognition, such as sequence logo analysis. The relative low cost and simplicity of the spoligotype assay means it can be performed by many laboratories and the digital nature of the data facilitates the exchange of information among researchers.
The growth in the availability of array-based assays has outpaced the ability of conventional software analysis packages to provide every possible method of analysis. Customized versions of software are extremely expensive, and researchers, who want to implement these protocols without specialized software, lack methods of collating the large amounts of data. Problems arise when attempts are made to judge the significance of similar but nonidentical array data. Identifying possible families in these array patterns may be important in understanding the evolution and spread of pathogens such as M. tuberculosis. Our method for collapsing array-based data can be used to find and present patterns or signature motifs in these types of data.
As previously noted (1), cluster analysis of large RFLP databases is difficult for a combination of reasons, including software failure and intralaboratory variations. Digital data, such as spoligotyping, mycobacterial interspersed repetitive unit (24), and variable number tandem repeat analyses (25), will probably form the basis for any large DNA fingerprinting projects in the future (26).
The design of large genotyping projects should include multiple methods (2,3,10,23). Strains that cluster by one typing method must be analyzed by other methods to ensure that the groupings represent clusters of true relatedness and not cases of convergent evolution.
Bioinformatic analyses, like logo analysis, may prove useful in obtaining further data from the large M. tuberculosis complex DNA typing databases already in existence. Spoligologo analysis is a graphic method of presenting similar spoligotypes that may elicit useful insights into the geographic spread of tuberculosis. Potential families of TB strains could be identified on the basis of their logo; these strains could then be analyzed by additional DNA-typing methods to confirm the relationship, followed examining relevant patient data (e.g., country of birth). A similar analysis was performed for the M. tuberculosis W-Beijing family (11) that helped elucidate the evolution of a multidrug–resistant strain in New York City. Spoligologo analysis could help identify more of these families, determine their global origin, and evaluate their spread.
Determining the sources and spread of tuberculosis is an important tool in preventing further infections. Understanding the geographic origin of an M. tuberculosis DNA fingerprint could be useful, especially in understanding the sources and spread of strains in the U.S. foreign-born population, among whom differentiating recently transmitted disease from reactivation of a past exposure can be difficult.
Dr. Driscoll works as associate director of the Northeast Regional Tuberculosis DNA Fingerprinting Laboratory at the Wadsworth Center of the New York State Department of Health. His research interests include the evolution and molecular epidemiology of the Mycobacterium tuberculosis complex.
Acknowledgments
We thank Ann Miller and Sharon Sharnprapai for patient data; Max Salfinger, Linda Parsons, Ben Zhao, Adelah Ebrahimzadeh, Paul Elvin, and Alissa Scharf for processing and shipping of cultures; and Christophe Sola for a critical reading of the manuscript.
This research was supported in part by the Centers for Disease Control and Prevention, National Tuberculosis Genotyping and Surveillance Network cooperative agreement, and the Pittsfield Massachusetts Anti-Tuberculosis Society.
References
- Braden CR, Templeton GL, Cave MD, Valway S, Onorato IM, Castro KG, Mycobacterium tuberculosis isolates from a state with a large rural population. J Infect Dis. 1997;175:1446–52. DOIPubMedGoogle Scholar
- Kremer K, van Soolingen D, Frothingham R, Haas WH, Hermans PW, Martin C, Comparison of methods based on different molecular epidemiologic markers for typing of Mycobacterium tuberculosis complex strains: interlaboratory study of discriminatory power and reproducibility. J Clin Microbiol. 1999;37:2607–18.PubMedGoogle Scholar
- Rhee JT, Tanaka MM, Behr MA, Agasino CB, Paz EA, Hopewell PC, Use of multiple markers in population-based molecular epidemiologic studies of tuberculosis. Int J Tuberc Lung Dis. 2000;4:1111–9.PubMedGoogle Scholar
- Salamon H, Behr M, Rhee JT, Small PM. Genetic distances for the study of infectious disease epidemiology. Am J Epidemiol. 2000;151:324–34.PubMedGoogle Scholar
- Sola C, Filliol I, Gutierrez C, Mokrousov I, Vincent V, Rastogi N. Spoligotype database of Mycobacterium tuberculosis: biogeographic distribution of shared types and epidemiologic and phylogenetic perspectives. Emerg Infect Dis. 2001;7:390–6.PubMedGoogle Scholar
- Sola C, Devallois A, Horgen L, Maisetti J, Filliol I, Legrand E, Tuberculosis in the Caribbean: using spacer oligonucleotide typing to understand strain origin and transmission. Emerg Infect Dis. 1999;5:404–14.PubMedGoogle Scholar
- van Embden JD, van Gorkom T, Kremer K, Jansen R, van der Zeijst BA, Schouls LM. Genetic variation and evolutionary origin of the direct repeat locus of Mycobacterium tuberculosis complex bacteria. J Bacteriol. 2000;182:2393–401. DOIPubMedGoogle Scholar
- Niang MN, Niang N, de la Salmoniere YG, Samb A, Hane AA, Cisse MF, Characterization of M. tuberculosis strains from West African patients by spoligotyping. Microbes Infect. 1999;1:1189–92. DOIPubMedGoogle Scholar
- Viana-Niero C, Gutierrez C, Sola C, Filliol I, Boulahbal F, Vincent V, Genetic diversity of Mycobacterium africanum clinical isolates based on IS6110-restrction fragment length polymorphism analysis, spoligotyping, and variable number of tandem DNA repeats. J Clin Microbiol. 2001;39:57–65. DOIPubMedGoogle Scholar
- Niemann S, Richter E, Rusch-Gerdes S. Differentiation among members of the Mycobacterium tuberculosis complex by molecular and biochemical features: evidence for two pyrazinamide-susceptible subtypes of M. bovis. J Clin Microbiol. 2000;38:152–7.PubMedGoogle Scholar
- Bifani PJ, Mathema B, Kurepina NE, Kreiswirth BN. Global dissemination of the Mycobacterium tuberculosis W-Beijing family strains. Trends Microbiol. 2002;10:45–52. DOIPubMedGoogle Scholar
- van Soolingen D, Qian L, de Haas PE, Douglas JT, Traore H, Portaels F, Predominance of a single genotype of Mycobacterium tuberculosis in countries of east Asia. J Clin Microbiol. 1995;33:3234–8.PubMedGoogle Scholar
- Kamerbeek J, Schouls L, Kolk A, van Agterveld M, van Soolingen D, Kuijper S, Simultaneous detection and strain differentiation of Mycobacterium tuberculosis for diagnosis and epidemiology. J Clin Microbiol. 1997;35:907–14.PubMedGoogle Scholar
- Tanaka MM, Small PM, Salamon H, Feldman MW. The dynamics of repeated elements: applications to the epidemiology of tuberculosis. Proc Natl Acad Sci U S A. 2000;97:3532–7. DOIPubMedGoogle Scholar
- Schneider TD, Stephens RM. Sequence logos: a new way to display consensus sequences. Nucleic Acids Res. 1990;18:6097–100. DOIPubMedGoogle Scholar
- Dale J, Brittain D, Cataldi A, Cousins D, Crawford J, Driscoll J, Spacer oligonucleotide typing of bacteria of the Mycobacterium tuberculosis complex: recommendations for standardized nomenclature. Int J Tuberc Lung Dis. 2001;5:216–9.PubMedGoogle Scholar
- van Embden JD, Cave MD, Crawford JT, Dale JW, Eisenach KD, Gicquel B, Strain identification of Mycobacterium tuberculosis by DNA fingerprinting: recommendations for a standardized methodology. J Clin Microbiol. 1993;31:406–9.PubMedGoogle Scholar
- Henikoff S, Henikoff JG, Alford WJ, Pietrokovski S. Automated construction and graphical presentation of protein blocks from unaligned sequences. Gene. 1995;163:GC17–26. DOIPubMedGoogle Scholar
- Schneider TD. Strong minor groove base conservation in sequence logos implies DNA distortion or base flipping during replication and transcription initiation. Nucleic Acids Res. 2001;29:4881–91. DOIPubMedGoogle Scholar
- Filliol I, Sola C, Rastogi N. Detection of a previously unamplified spacer within the DR locus of Mycobacterium tuberculosis: epidemiological implications. J Clin Microbiol. 2000;38:1231–4.PubMedGoogle Scholar
- Centers for Disease Control and Prevention. Recommendations for prevention and control of tuberculosis among foreign-born persons. Report of the working group on tuberculosis among foreign-born persons. MMWR Morb Mortal Wkly Rep. 1998;47(RR-16):1–29.PubMedGoogle Scholar
- Borgdorff MW, Behr MA, Nagelkerke NJ, Hopewell PC, Small PM. Transmission of tuberculosis in San Francisco and its association with immigration and ethnicity. Int J Tuberc Lung Dis. 2000;4:285–6.PubMedGoogle Scholar
- Sola C, Filliol I, Legrand E, Mokrousov I, Rastogi N. Mycobacterium tuberculosis phylogeny reconstruction based on combined numerical analysis with IS1081, IS6110, VNTR and DR-based spoligotyping suggests the existence of two new phylogeographical clades. J Mol Evol. 2001;53:680–9. DOIPubMedGoogle Scholar
- Supply P, Mazars E, Lesjeans S, Vincent V, Gicquel B, Locht C. Variable human minisatellite-like regions in the Mycobacterium tuberculosis genome. Mol Microbiol. 2000;36:762–71. DOIPubMedGoogle Scholar
- Frothingham R, Meeker-O’Connell WA. Genetic diversity in the Mycobacterium tuberculosis complex based on variable numbers of tandem DNA repeats. Microbiology. 1998;144:1189–90. DOIPubMedGoogle Scholar
- Supply P, Lesjean S, Savine E, Kremer K, van Soolingen D, Locht C. Automated high-throughput genotyping for study of global epidemiology of Mycobacterium tuberculosis based on mycobacterial interspersed repetitive units. J Clin Microbiol. 2001;39:3563–71. DOIPubMedGoogle Scholar
Figures
Cite This ArticleTable of Contents – Volume 8, Number 11—November 2002
| EID Search Options |
|---|
|
|
|
|
|
|
Please use the form below to submit correspondence to the authors or contact them at the following address:
Jeffrey R. Driscoll, Division of Infectious Diseases, Wadsworth Center, New York State Department of Health, P.O. Box 22002, New Scotland Ave., Albany, NY 12201-2002, USA; fax: 518-473-1326;
Top