Volume 9, Number 6—June 2003
Research
Molecular Subtyping to Detect Human Listeriosis Clusters
Abstract
We analyzed the diversity (Simpson’s Index, D) and distribution of Listeria monocytogenes in human listeriosis cases in New York State (excluding New York City) from November 1996 to June 2000 by using automated ribotyping and pulsed-field gel electrophoresis (PFGE). We applied a scan statistic (p<0.05) to detect listeriosis clusters caused by a specific Listeria monocytogenes subtype. Of 131 human isolates, 34 (D=0.923) ribotypes and 74 (D=0.975) PFGE types were found. Nine (31% of cases) clusters were identified by ribotype or PFGE; five (18% of cases) clusters were identified by using both methods. Two of the nine clusters (13% of cases) identified corresponded with investigated multistate listeriosis outbreaks. While most human listeriosis cases are considered sporadic, highly discriminatory molecular subtyping approaches thus indicated that 13% to 31% of cases reported in New York State may represent single-source clusters. Listeriosis control and reduction efforts should include broad-based subtyping of human isolates and consider that a large number of cases may represent outbreaks.
Listeria monocytogenes is a bacterial foodborne pathogen that can cause severe invasive disease manifestations, including abortion, septicemia, and meningitis. While multiple large outbreaks have been recognized, most cases are thought to be sporadic (1). Human listeriosis is relatively rare, typically includes long incubation periods (7–60 days), usually results in hospitalization (85% to 90%), and often results in death (<30%) (2). Persons with specific immunocompromising conditions, pregnant women, and newborns appear to be particularly susceptible to invasive listeriosis, and most reported cases occur in these specific risk groups (3,4). Various studies indicate that from 1% to 5% of common ready-to-eat foods may contain L. monocytogenes (5–7), and these foods may be widely distributed as a result of current marketing and distribution practices. Traditional epidemiologic surveillance alone may not detect many common source outbreaks, particularly if a limited number of cases occur over a wide geographic area (8,9) because of the unique characteristics of human foodborne listeriosis.
Subtyping methods for L. monocytogenes include phenotypic (e.g., serotyping and phage-typing) as well as different DNA-based subtyping methods. Phenotypic methods often yield a low power of discrimination in strains (e.g., >90% of all human isolates represent 3 of the 13 known serotypes), suffer from biologic variability (e.g., phage typing), and may not be applicable to all strains (10). Molecular subtyping methods include multilocus enzyme electrophoresis, ribotyping, pulsed-field gel electrophoresis (PFGE), polymerase chain reaction (PCR), and restriction-fragment length polymorphism (RFLP) analysis. Automated ribotyping was previously used for rapid subtyping L. monocytogenes for source tracking, population genetics–based studies, and epidemiologic investigations (11–13); however, it is expensive and not as discriminatory as PFGE (14). PFGE provides sensitive subtype discrimination and is often considered the standard subtyping method for L. monocytogenes (15). However, this method is not automated and is labor intensive. Even recently developed rapid protocols take approximately 30 hours to perform (10,15).
We used two molecular subtyping methods (automated EcoRI ribotyping and AscI PFGE) to evaluate and compare their discriminatory power and utility and to estimate the incidence of single source clusters among human listeriosis cases. A scan statistic with an underlying Poisson distribution was used to detect the occurrence of temporal clusters caused by indistinguishable subtypes. A space-time scan statistic was used to evaluate spatial and temporal clustering on the basis of county of patient residence and a 3-month window.
Isolates and Case Reporting
In New York State, Public Health Law 2102 requires that laboratories and physicians immediately report isolation of L. monocytogenes from a sterile site (e.g., blood or cerebrospinal fluid) to public health authorities (16). Furthermore, local diagnostic and clinical laboratories are asked to submit all L. monocytogenes isolates to the New York State Department of Health Wadsworth Center. Through this system, L. monocytogenes isolates from cases of human invasive disease among New York State residents (excluding New York City, which is served more directly by the local health department) were collected over 44 months (November 1996 through June 2000). Only one isolate per patient was analyzed; therefore, each isolate in this study represents a single, unique listeriosis case. All isolates were confirmed by conventional biochemical tests at the Wadsworth Center. Standardized L. monocytogenes serotyping reagents were not available and serotyping was thus not performed.
County health departments reported epidemiologic information to the New York State Department of Health’s Bureau of Communicable Disease. Local health department’s systematic review of case reports aided identification of potential outbreak cases when large increases in listeriosis cases (irrespective of subtype) were reported. Our study is a retrospective laboratory subtype analysis, which did not include routine comprehensive risk factor analysis (i.e., history of food eaten).
Automated Ribotyping
Ribotyping was performed by using the restriction enzyme EcoRI and the RiboPrinter Microbial Characterization System (Qualicon Inc., Wilmington, DE) as previously described (17,18).
PFGE Analysis
PFGE was performed according to PulseNet protocol (15). ApaI PFGE patterns typically display more bands than AscI patterns and may offer higher levels of discrimination; however, AscI patterns typically have patterns with bands that are more easily analyzed by software and the human eye because of greater average distances between bands. While the current PulseNet protocol (15) recommends the use of both ApaI and AscI for PFGE typing of L. monocytogenes, only AscI was used in this study, which was initiated before formal inclusion of L. monocytogenes into PulseNet. Bacterial cultures were embedded in agarose, lysed, washed, and digested with the restriction enzyme AscI for 4 h at 37°C and electrophoresed on a Chef Mapper XA (BioRad Laboratories, Hercules, CA) at 6 V/cm for 22 h with switch times of 4 s to 40.01 s. Pattern images were acquired by using a BioRad Gel Doc with Multi Analyst software (Bio-Rad Laboratories) (v. 1.1) and compared by using the Applied Maths Bionumerics (Applied Maths, Saint-Martins-Latem, Belgium) (v. 2.5) software package. Pattern clustering was performed by using the unweighted pairs group matching algorithm and the Dice correlation coefficient (15).
Strain Nomenclature
Ribotype patterns were automatically assigned a DuPont ID (e.g., DUP-1044) by the Riboprinter Microbial Characterization System (Qualicon, Inc.); each pattern was confirmed by visual inspection. If visual inspection found that a given DuPont ID included more than one distinct ribotype pattern, each pattern was designated by an alphabetically assigned additional letter (e.g., DUP-1044A and DUP-1044B represent two distinct ribotype patterns within DuPont ID DUP-1044). Distinct ribotype patterns within a given DuPont ID generally differed by position of a single weak band. If a ribotype pattern did not match a DuPont ID pattern with a similarity >0.85, a type designation was assigned manually based on the ribogroup assigned by the instrument (e.g., ribogroup 116-363-S-2). Ribotype patterns (and other subtype data) for isolates in this study are available for comparison on the Internet (available from: URL: www.pathogentracker.net). PFGE patterns differing by at least one band from a previously recognized type were given an indexed type comprise a two-letter geographic prefix, a four-digit year of first isolation, a three-letter restriction enzyme code, and a four-digit sequential number (e.g., NY1996ASC0001).
Simpson’s Index of Discrimination
The suitability of typing methods for differentiation of strains was determined by using Simpson’s Numerical Index (19). This index was calculated for each typing method, as well as for the combination of both methods.
Cluster Detection Algorithm by Using a Scan Statistic
Figure 1
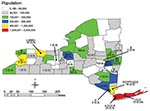
The scan statistic (20,21) maintains the assumption that an underlying Poisson distribution and a stable population at risk over time describes the occurrence of rare events. This statistic tests the null hypothesis that the incidence of events within a given time window is equal to the incidence of events outside the window. We used a conditional Poisson distribution to describe the occurrence of individual L. monocytogenes subtypes over 44 months. Since the incubation period of listeriosis can be up to 70 days, we determined the temporal distribution of ribotypes and PFGE types for both 1- and 3-month windows. To determine the threshold value of occurrences, indicating a larger than expected number of events per window, we compared the number of occurrences in a given period to the expected maximum number of events in a given window. The expected number is calculated under the assumption that individual occurrences occur randomly with an identical rate over time. The conditional Poisson probability is given by: P(n | N, p)= Pr(nobs > n), where nobs is the observed cluster size in a window, N is the total number of events during the total period, and p is the relative window length (the length of the window in months divided by the length of the total period). Statistically significant clusters were identified when the number of isolates with a given subtype in the study window was greater than expected under the Poisson assumption. Exact p values were obtained from statistical tables (22). Clusters of ribotypes or PFGE types were evaluated by using a Poisson distribution with a mean rate equal to the number of occurrences divided by the total observation period. No corrections for seasonality were applied because analysis was performed at the subtype level and a large number of subtypes were observed. Furthermore, the prevalence of the different subtypes did not vary consistently by season, and correction was not warranted. Time-space clustering was evaluated by using a similar algorithm (SatScan 2.1.3, National Cancer Institute 1998) (23); however, only 3-month windows were evaluated. Case numbers were converted to case rate (cases/100,000) to account for the source population size. Time clustering within a 3-month window was combined with space clustering in an area with a maximum space window size of 15% of the total space. Kulldorff (24) recommended using a maximum space window size of up to 50% of the total space, while others reported using smaller values on the basis of the geographic boundaries studied. Norstrom et al. (25) used a 10% space window to avoid scanning outside the geographic region of study. We used a window of 15% of the total space. Since exact patient location (zip code or address) was not available, analysis was performed by using county of residence data, which provided a better chance of identifying local clusters within a small food distribution area. Each case was assigned the spatial coordinates of the county in which the patient was residing (Figure 1). Statistical significance for all tests was defined as p<0.05.
Cases
From November 1996 through June 2000, a total of 135 L. monocytogenes isolates were collected from human cases, with four mother/newborn pairs of isolates. All four isolates from the newborns matched the subtype of the respective mother and were not included in our analysis. The incidence of reported isolates ranged from 0 to 13 per month, with a median of three. Isolates were seasonally distributed with peaks in July 1997 (n=5), October 1998 (n=13), and September 1999 (n=9). On the basis of the 2000 census population estimate of 10,968,179 (26) for New York State (excluding New York City), we detected a listeriosis rate of 0.33 cases per 100,000. Cases were distributed across the state (Figure 1). Case-patient ages ranged from <1 day to 98 years with a median age of 66 years. Gender was reported for all cases; 76 (58%) of case-patients were female.
A total of 34 ribotypes and 74 PFGE types were differentiated among the 131 human isolates; 19 ribotypes and 50 PFGE types were unique (i.e., represented by only one patient isolate). Ribotypes DUP-1044A and DUP-1052A were each prevalent in >10% of cases, and these two ribotypes alone accounted for 39% of cases. One PFGE type (NY1997ASC0010) accounted for 13% of cases. No other PFGE types accounted for >5% of cases.
Discriminatory Ability of Typing Methods
Simpson’s Index was used to determine the discriminatory power of the subtyping methods used. The D value was 0.923 for ribotyping, 0.975 for PFGE, and 0.980 for combined use of both typing techniques. PFGE further discriminated most ribotypes (Table 1); however, three isolates with indistinguishable PFGE types were further differentiated into two ribotypes (Table 1, cluster E).
Cluster Detection
Figure 2
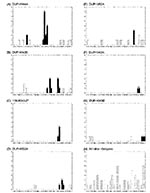
Figure 2. Temporal distribution of listeriosis clusters detected based on ribotype or pulsed-field gel electrophoresis (PFGE) data, using a 3-month window scan statistic. Panels A–G each show the distribution of cases caused by...
Ribotyping and PFGE subtyping data were analyzed separately by using a scan statistic on 1- and 3-month windows to detect statistically significant clusters of identical ribotypes and PFGE types. A total of 9 clusters representing 41 (31%) cases were detected by ribotyping, PFGE, or both (Tables 1 and 2). Clusters were detected throughout the study period (Figure 2). Two clusters (B and G) were epidemiologically linked to national outbreaks and known sources and included 17 (13%) cases. The remaining seven clusters were not epidemiologically defined as outbreaks, and the exact source of exposure was undetermined. Ribotype-based scanning with 1-month periods detected two clusters (Table 1, B and E), with 3-month periods, and scanning detected six clusters (B, C, E, F, H, and I). PFGE-based scanning with 1-month periods detected five clusters (A, B, E, F, G), with 3-month periods; eight clusters were detected (A, B, D, E, F, G, H, and I). All clusters identified by using 1-month periods were also identified by using 3-month periods.
Figure 3
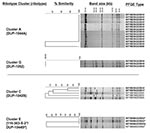
Figure 3. Comparison of AscI pulsed-field gel electrophoresis (PFGE) patterns for isolates from selected ribotype clusters. AscI PFGE types are shown for two clusters representing epidemiologically confirmed outbreaks (A and G), one ribotype...
A total of six ribotype-based clusters (Table 1; B, C, E, F, H, and I) of two or more isolates (p<0.05) were detected, representing a total of 31 (24%) cases. PFGE alone identified eight clusters (A, B, D, E, F, G, H, and I), representing a total of 31 (24%) cases. Ribotyping and PFGE results were used to further refine clusters detected by the scan statistic. All six ribotype clusters contained at least two indistinguishable or closely related (<3 bands different) PFGE patterns. For the purpose of refining ribotype clusters, we interpreted PFGE patterns differing by <3 bands from each other as possibly being clonally related and sharing a recent enough common ancestor to be grouped together for epidemiologic investigations (27). Three of these clusters (C, E, and I) contained one or more isolates removed from the ribotyped-based cluster because they were considered not closely related to the most common PFGE pattern in the respective cluster (see Figure 3 for two examples of ribotype clusters with multiple PFGE types and two examples of ribotype clusters with indistinguishable or closely related PFGE types). Overall, ribotype clusters that were further supported by indistinguishable or closely related PFGE types represented 26 (20%) cases (Table 2). Of the eight PFGE clusters detected, all, except one (Figure 3, cluster E), comprised isolates with identical ribotypes. Overall, five clusters (B, E, F, H, and I; 23 cases) were detected by the temporal scan statistic on the basis of both ribotype and PFGE data.
Space-time cluster analysis independently identified three of the ribotype clusters (B, G, and H) and five of the PFGE clusters (B, D, G, H, and I). While some geographic clusters were located within one county (D and G), others comprised cases in one or more counties (B, H, and I). Cluster B comprised two main geographic clusters; one included five cases (Rensselaer and Columbia Counties), and the other included six cases (Broome, Monroe, and Onondaga Counties). An additional three cases from cluster B (Table 1), detected by the temporal scan statistic, were not detected by the space-time analysis (two cases in Albany and one in Erie Counties).
L. monocytogenes causes a rare, severe human foodborne disease and is responsible for an estimated 2,500 human cases and 500 deaths annually in the United States (28). Most of these cases have been considered sporadic, and comparatively few outbreaks have been reported worldwide (1). The best quantitative estimates of the true number of L. monocytogenes infections come from the FoodNet program, which conducts population-based active laboratory surveillance for foodborne diseases at 10 sites in the United States that represent 10.8% of the U.S. population (2). FoodNet aggregate data from 1996 to 2000 show that the reported listeriosis rates among participating sites ranged from 3 to 6 cases per million population per year. The 131 case isolates collected over 44 months in this study translate to a rate of 3.3 cases per million population per year. This rate is within the reported case prevalence from FoodNet sites (2), indicating that the capture rate achieved in this study is within the expected range.
Comparison of Genotyping Methods
Rapid, reproducible, and discriminatory subtyping methods are important in conducting effective surveillance. While others have shown that PFGE and ribotyping are highly discriminatory for typing L. monocytogenes (29–32), no comprehensive reports evaluated typing strategies on human isolates from a broad-based surveillance program (29–32). While our data show that EcoRI ribotyping and AscI PFGE typing provide discriminatory subtyping approaches for human listeriosis isolates (Simpson’s index of 0.923 and 0.975, respectively), we also found that most ribotypes could be further differentiated by AscI PFGE. Since PFGE types of epidemiologically related isolates may differ by <3 bands from each other (27), small clusters (e.g., cluster D) involving related but distinct (<3 bands difference) isolates may not be detected by PFGE typing but can be detected by ribotyping, which appears to target more conserved genetic characteristics.
Detection and Definition of Listeriosis Clusters and Outbreaks
Within the 3 1/2-year study period covered by this report, nine putative case clusters (representing 31% of cases) were identified by using the scan statistic based on ribotyping or PFGE data. Application of the scan statistic for cluster detection ensured that putative clusters accounted for the relative abundance of L. monocytogenes ribotypes and PFGE types. Five clusters, representing 18% of all cases, were supported statistically by both subtyping methods. Of the six ribotype clusters identified by using the scan statistic, all contained isolates with closely related PFGE types. When refined to include only closely related PFGE types (<3 bands difference), these six clusters represent 20% of the cases reported during the surveillance period. Cluster C contained five PFGE types, including three that were more than five bands different and two that were two bands different, indicating that these cases were unrelated. The relevance of both PFGE and ribotyping-based cluster detection by means of the scan statistic is supported by the observation that two of the clusters detected by one or both methods represent clusters that were part of epidemiologically confirmed multistate human foodborne listeriosis outbreaks. Cluster B (Table 1), which included 14 cases in New York State that were ribotype DUP-1044A, was part of a multistate outbreak with 101 cases (including 21 deaths) linked to eating L. monocytogenes–contaminated hot dogs (12,33). All cases from Cluster B, including the one case with a PFGE pattern that differed by a single band from the other isolates (Figure 3), were epidemiologically linked to the national outbreak. A second cluster (cluster G) was connected to cases in Maryland, New York, and Connecticut and was linked by subtyping and epidemiologically to contaminated paté (34,35). These two clusters represented 13% of all cases reported in New York State during this surveillance period. Because of the retrospective nature of this study, no epidemiologic data were available to link the cases representing the other subtype clusters.
While many reports claim that most listeriosis cases are sporadic (2–4,7), our data show that a considerable proportion of human listeriosis cases represent subtype clusters, some or all of which may represent common source outbreaks. Such clusters may have also occurred before 1997 and in other states and countries. While many of the subtype clusters detected in New York State appear to be small, some involved additional cases outside the state, and some cases connected with these clusters may never have been diagnosed. As nationwide surveillance and genotyping systems such as PulseNet (36) become fully implemented, a much larger number of human listeriosis clusters and outbreaks may be recognized and linked to specific food sources. Subtyping methods will only provide their full public health benefit if routine food histories are obtained for all listeriosis patients to provide the epidemiologic support for putative single genotype clusters. Complete routine food histories were not obtained as part of this study but were administered when putative outbreaks (such as clusters B and G) were detected before application of the statistical algorithm described here.
While some clusters defined by the temporal scan statistic also represented statistically significant spatial clusters (Figure 1, D, G, H, and I;), other temporal clusters included cases distributed across the state (A, B, C, E, and F). Cluster B included two smaller space-time clusters as well as other cases distributed across the state; all of these cases were epidemiologically linked. These patterns are consistent with those of previously reported human listeriosis outbreaks. Some previous outbreaks of listeriosis have been represented as geographic clusters associated with localized consumption of a contaminated food item (e.g., outbreaks in North Carolina [37] and California [38] linked to Hispanic-style cheeses). Other outbreaks were geographically dispersed and included cases in many states; these clusters were caused by a widely distributed contaminated food item (such as the multistate outbreak in 1998–99 [12]; cluster B). Our results further suggest that human listeriosis clusters and outbreaks may occur in two distinct patterns, including localized, geographically confined, and dispersed clusters. This epidemiologic spreading pattern indicates that time clustering is probably at least as effective in detecting clusters as combined space-time clustering.
Cluster Detection Methods
While some efforts to track L. monocytogenes subtypes responsible for human cases over time have been published (39,40), we show that the use of comprehensive multimethod genotyping approaches in conjunction with formal statistical means for detecting putative listeriosis clusters may help provide a better understanding of the epidemiologic characteristics of this disease. While the combination of typing and normal distribution-based statistical algorithms for outbreak detection has been shown to be effective for detecting outbreaks for more common foodborne diseases such as salmonellosis (41), different approaches are needed to effectively detect clusters for rare diseases such as listeriosis. Therefore, we used PFGE and ribotyping subtyping in conjunction with the Poisson-distribution-based scan statistic to detect listeriosis clusters. The scan statistic was chosen since this method has previously been applied to detect clusters of other rare diseases, e.g., variant Creutzfeldt-Jakob disease (24,42,43). Because of the long incubation period of listeriosis, the scan statistic was performed by using both 1- and 3-month windows. Our data showed that all clusters detected with the 1-month window were also detected with the 3-month window size. Further validation of appropriate window sizes for these analyses by using epidemiologically confirmed outbreaks will be necessary to define the optimal parameters for the scan statistic analysis. While EcoRI ribotyping was shown to be less discriminatory than AscI PFGE typing, PFGE patterns differing by <3 bands from each other may possibly be clonally related and share a recent enough common ancestor to be grouped together for epidemiologic investigations (27). Consequently, the use of the more discriminatory PFGE subtyping data alone may sometime miss clusters caused by clonally related isolates, which may not necessarily share completely identical PFGE patterns, if only the completely identical PFGE patterns (0 band difference) are grouped together as a single PFGE type. The use of only ribotyping data may overestimate the number of clusters because of the lower discriminatory ability of ribotyping. We showed that PFGE data further refined the initially defined ribotype clusters and eliminated clusters that contained isolates with distinct PFGE subtypes.
Conventional surveillance for listeriosis and other foodborne diseases often relies upon species or serotype characterization to define reportable conditions, yet for many organisms genotyping can provide improved discrimination below the species or serotype level. In conjunction with statistical analyses, routine genotyping allowed us to identify a considerable number of putative temporal clusters of listeriosis. Our data show that 13% of reported human listeriosis cases in New York State represented epidemiologically supported single-source, multicase clusters. On the basis of molecular subtyping data alone, as many as 31% of the listeriosis cases may have represented clusters. We propose that a considerable number of human listeriosis cases may occur in clusters, many or some of which may represent single-source outbreaks that in the past went undetected. The combined use of molecular subtyping methods, statistical data analysis, and epidemiologic investigations thus may further improve our ability to detect human listeriosis outbreaks.
The U.S. Department of Health and Human Services Healthy People 2010 plan calls for a reduction of human listeriosis from 0.5 to 0.25 cases per 100,000 by the year 2010 (44). Efforts to reduce Listeria species in the processing environment appear to have reduced the incidence of listeriosis from a peak of 0.8 cases per 100,000 in the early 1990s, but the incidence has remained at approximately 0.3–0.6 cases per 100,000 since 1996 (7,45). Our study suggests that single-source clusters represent a much larger number of listeriosis cases than previously assumed. We provide a model for an integrated, statistically based, molecular subtyping approach to identifying putative foodborne listeriosis clusters. In conjunction with broad-based collection of conventional epidemiologic data, this approach may allow for more rapid detection of even smaller outbreaks, which currently are often unrecognized. Rapid cluster detection can help detect and eliminate outbreak sources and prevent additional cases, thus providing an opportunity to reduce the overall incidence of foodborne listeriosis. Improved outbreak detection furthermore will provide an opportunity to better define the specific food sources of human listeriosis cases.
Mr. Sauders is a Ph.D. student in the Department of Food Science, Cornell University, and a former Centers for Disease Control and Prevention/Association of Public Health Laboratories Emerging Infectious Diseases Training Fellow. His research interests focus on using molecular subtyping strategies to better understand the ecologic, epidemiologic, and transmission dynamics of foodborne infectious diseases.
Acknowledgment
This work was supported in part by the Centers for Disease Control and Prevention Emerging Infections Program (to D.M.), U.S. Department of Agriculture National Research Initiative Award No. 99-35201-8074 (to M.W.), and the National Institutes of Health Award No. R01GM63259 (to M.W.).
References
- Slutsker L, Schuchat A. Listeriosis in humans. In: Ryser ET, Marth EH, editors. Listeria, listeriosis, and food safety. 2nd ed. New York: Marcel Dekker; 1999. p. 75–95.
- Wallace DJ, Van Gilder T, Shallow S, Fiorentino T, Segler SD, Smith KE, Incidence of foodborne illnesses reported by the foodborne diseases active surveillance network (FoodNet), 1997. FoodNet Working Group. J Food Prot. 2000;63:807–9.PubMedGoogle Scholar
- Schuchat A, Deaver KA, Wenger JD, Plikaytis BD, Mascola L, Pinner RW, Role of foods in sporadic listeriosis. I. Case-control study of dietary risk factors. The Listeria Study Group. JAMA. 1992;267:2041–5. DOIPubMedGoogle Scholar
- Soriano JM, Rico H, Molto JC, Manes J. Listeria species in raw and ready-to-eat foods from restaurants. J Food Prot. 2001;64:551–3.PubMedGoogle Scholar
- Wilson IG. Occurrence of Listeria species in ready to eat foods. Epidemiol Infect. 1995;115:519–26. DOIPubMedGoogle Scholar
- Pinner RW, Schuchat A, Swaminathan B, Hayes PS, Deaver KA, Weaver RE, Role of foods in sporadic listeriosis. II. Microbiologic and epidemiologic investigation. The Listeria Study Group. JAMA. 1992;267:2046–50. DOIPubMedGoogle Scholar
- Altekruse SF, Cohen ML, Swerdlow DL. Emerging foodborne diseases. Emerg Infect Dis. 1997;3:285–93. DOIPubMedGoogle Scholar
- Tauxe RV. Emerging foodborne diseases: an evolving public health challenge. Emerg Infect Dis. 1997;3:425–34. DOIPubMedGoogle Scholar
- Graves LM, Swaminathan B, Hunter SB. Subtyping Listeria monocytogenes. In: Ryser ET, Marth EH, editors. Listeria, listeriosis, and food safety. 2nd ed. New York: Marcel Dekker; 1999. p. 279–97.
- Wiedmann M. Molecular subtyping methods for Listeria monocytogenes. J AOAC Int. 2002;85:524–31.PubMedGoogle Scholar
- Centers for Disease Control and Prevention. Update: multistate outbreak of listeriosis—United States, 1998–1999. MMWR Morb Mortal Wkly Rep. 1999;47:1117–8.PubMedGoogle Scholar
- Centers for Disease Control and Prevention. Multistate outbreak of listeriosis—United States, 2000. MMWR Morb Mortal Wkly Rep. 2000;49:1129–30.PubMedGoogle Scholar
- Inglis TJ, O’Reilly L, Foster N, Clair A, Sampson J. Comparison of rapid, automated ribotyping and DNA macrorestriction analysis of Burkholderia pseudomallei. J Clin Microbiol. 2002;40:3198–203. DOIPubMedGoogle Scholar
- Graves LM, Swaminathan B. PulseNet standardized protocol for subtyping Listeria monocytogenes by macrorestriction and pulsed-field gel electrophoresis. Int J Food Microbiol. 2001;65:55–62. DOIPubMedGoogle Scholar
- New York State Public Health Law 2102.
- Bruce JL, Hubner RJ, Cole EM, McDowell CI, Webster JA. Sets of EcoRI fragments containing ribosomal RNA sequences are conserved among different strains of Listeria monocytogenes. Proc Natl Acad Sci U S A. 1995;92:5229–33. DOIPubMedGoogle Scholar
- Bruce JL. Automated system rapidly identifies and characterizes microorganisms in food. Food Technol. 1996;50:77–81.
- Hunter PR, Gaston MA. Numerical index of the discriminatory ability of typing systems: an application of Simpson’s index of diversity. J Clin Microbiol. 1988;26:2465–6.PubMedGoogle Scholar
- Weinstock MA. A generalised scan statistic test for the detection of clusters. Int J Epidemiol. 1981;10:289–93. DOIPubMedGoogle Scholar
- Wallenstein S. A test for detection of clustering over time. Am J Epidemiol. 1980;111:367–72.PubMedGoogle Scholar
- Neff ND, Naus JI. The distribution of the size of the maximum cluster of points on a line. Providence (RI): Institute of Mathematical Statistics, American Mathematical Society; 1980.
- Kulldorff M, Athas WF, Feurer EJ, Miller BA, Key CR. Evaluating cluster alarms: a space-time scan statistic and brain cancer in Los Alamos, New Mexico. Am J Public Health. 1998;88:1377–80. DOIPubMedGoogle Scholar
- Kulldorff M. Prospective time periodic geographical disease surveillance using a scan statistic. [Ser A]. JR Stat Soc. 2001;164:61–72.
- Norstrom M, Pfeiffer DU, Jarp J. A space-time cluster investigation of an outbreak of acute respiratory disease in Norwegian cattle herds. Prev Vet Med. 2000;47:107–19. DOIPubMedGoogle Scholar
- Anonymous . Census 2000: Washington: U.S. Census Bureau; 2000.
- Tenover FC, Arbeit RD, Goering RV, Mickelsen PA, Murray BE, Persing DH, Interpreting chromosomal DNA restriction patterns produced by pulsed-field gel electrophoresis: criteria for bacterial strain typing. J Clin Microbiol. 1995;33:2233–9.PubMedGoogle Scholar
- Mead PS, Slutsker L, Dietz V, McCaig LF, Bresee JS, Shapiro C, Food-related illness and death in the United States. Emerg Infect Dis. 1999;5:607–25. DOIPubMedGoogle Scholar
- Buchrieser C, Brosch R, Catimel B, Rocourt J. Pulsed-field gel electrophoresis applied for comparing Listeria monocytogenes strains involved in outbreaks. Can J Microbiol. 1993;39:395–401. DOIPubMedGoogle Scholar
- Brosch R, Chen J, Luchansky JB. Pulsed-field fingerprinting of Listeria: identification of genomic divisions for Listeria monocytogenes and their correlation with serovar. Appl Environ Microbiol. 1994;60:2584–92.PubMedGoogle Scholar
- Bille J, Rocourt J. WHO International Multicenter Listeria monocytogenes Subtyping Study—rationale and set-up of the study. Int J Food Microbiol. 1996;32:251–62. DOIPubMedGoogle Scholar
- Kerouanton A, Brisabois A, Denoyer E, Dilasser F, Grout J, Salvat G, Comparison of five typing methods for the epidemiological study of Listeria monocytogenes. Int J Food Microbiol. 1998;43:61–71. DOIPubMedGoogle Scholar
- Centers for Disease Control and Prevention. Multistate outbreak of listeriosis—United States, 1998. MMWR Morb Mortal Wkly Rep. 1998;47:1085–6.PubMedGoogle Scholar
- D’artagnan expands recall of mousse truffee for possible Listeria contamination. Washington: United States Department of Agriculture Food Safety Inspection Service Recall Press Releases; 1999. [accessed 4/5/03] Available from: URL: http://www.fsis.usda.gov/OA/recalls/prelease/pr061-99a.htm
- Hunter SB, Tucker N, Ong ARB, The Listeria monocytogenes database in PulseNet; the National Molecular Subtyping Network for Foodborne Disease Surveillance in the United States. Paper presented at: International Symposium on Problems of Listeriosis XIV, 2001; Mannheim, Germany. Proceedings of the International Symposium on Problems of Listeriosis XIV.
- Swaminathan B, Barrett TJ, Hunter SB, Tauxe RV. PulseNet: the molecular subtyping network for foodborne bacterial disease surveillance, United States. Emerg Infect Dis. 2001;7:382–9.PubMedGoogle Scholar
- Centers for Disease Control and Prevention. Outbreak of listeriosis associated with homemade Mexican-style cheese—North Carolina, October 2000–January 2001. MMWR Morb Mortal Wkly Rep. 2001;50:560–2.PubMedGoogle Scholar
- Linnan MJ, Mascola L, Lou XD, Goulet V, May S, Salminen C, Epidemic listeriosis associated with Mexican-style cheese. N Engl J Med. 1988;319:823–8. DOIPubMedGoogle Scholar
- Jacquet C, Catimel B, Brosch R, Buchrieser C, Dehaumont P, Goulet V, Investigations related to the epidemic strain involved in the French listeriosis outbreak in 1992. Appl Environ Microbiol. 1995;61:2242–6.PubMedGoogle Scholar
- Bibb WF, Gellin BG, Weaver R, Schwartz B, Plikaytis BD, Reeves MW, Analysis of clinical and food-borne isolates of Listeria monocytogenes in the United States by multilocus enzyme electrophoresis and application of the method to epidemiologic investigations. Appl Environ Microbiol. 1990;56:2133–41.PubMedGoogle Scholar
- Hutwagner LC, Maloney EK, Bean NH, Slutsker L, Martin SM. Using laboratory-based surveillance data for prevention: an algorithm for detecting Salmonella outbreaks. Emerg Infect Dis. 1997;3:395–400. DOIPubMedGoogle Scholar
- Cousens S, Smith PG, Ward H, Everington D, Knight RS, Zeidler M, Geographical distribution of variant Creutzfeldt-Jakob disease in Great Britain, 1994-2000. Lancet. 2001;357:1002–7. DOIPubMedGoogle Scholar
- D’Aignaux JH, Cousens SN, Delasnerie-Laupretre N, Brandel JP, Salomon D, Laplanche JL, Analysis of the geographical distribution of sporadic Creutzfeldt-Jakob disease in France between 1992 and 1998. Int J Epidemiol. 2002;31:490–5. DOIPubMedGoogle Scholar
- Healthy people 2010: Office of Disease Prevention and Health Promotion. Washington: U.S. Department of Health and Human Services; 2001.
- Tappero JW, Schuchat A, Deaver KA, Mascola L, Wenger JD. Reduction in the incidence of human listeriosis in the United States. Effectiveness of prevention efforts? The Listeriosis Study Group. JAMA. 1995;273:1118–22. DOIPubMedGoogle Scholar
Figures
Tables
Cite This ArticleTable of Contents – Volume 9, Number 6—June 2003
| EID Search Options |
|---|
|
|
|
|
|
|
Please use the form below to submit correspondence to the authors or contact them at the following address:
Martin Wiedmann, Cornell University, Department of Food Science, 412B Stocking Hall, Ithaca, NY 14853, USA; fax: 607-254-4868
Top