Serologic Surveillance of Anthrax in the Serengeti Ecosystem, Tanzania, 1996–2009
Tiziana Lembo, Katie Hampson

, Harriet Auty, Cari A. Beesley, Paul Bessell, Craig Packer, Jo Halliday, Robert D. Fyumagwa, Richard Hoare, Eblate Ernest, Christine Mentzel, Titus Mlengeya, Karen Stamey, Patricia P. Wilkins, and Sarah Cleaveland
Author affiliations: Author affiliations: University of Glasgow, Glasgow, Scotland (T. Lembo, K. Hampson, H. Auty, P. Bessell, S. Cleaveland); Lincoln Park Zoo, Chicago, Illinois, USA (T. Lembo); Centers for Disease Control and Prevention, Atlanta, Georgia, USA (C.A. Beesley, K. Stamey, P.P. Wilkins); University of Minnesota, St. Paul, Minnesota, USA (C. Packer); University of Edinburgh, Edinburgh, Scotland (J. Halliday); Tanzania Wildlife Research Institute, Arusha, Tanzania (R. Fyumagwa, R. Hoare, E. Ernest); Endangered Wildlife Trust, Parkview, South Africa (C. Mentzel); Tanzania National Parks, Arusha (T. Mlengeya)
Main Article
Figure 2
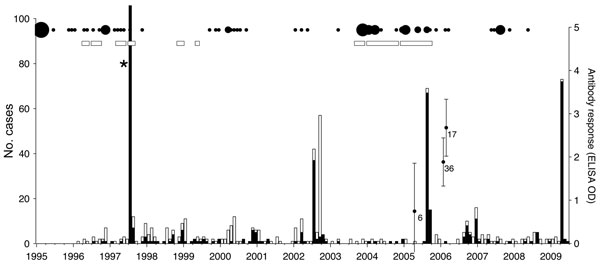
Figure 2. Anthrax case detection in wildlife, livestock, and human populations in the Serengeti ecosystem, Tanzania, 1996–2009. Probable (black bars) and suspected (white bars) wildlife cases (as defined in the Materials and Methods) are shown. Black circles indicate hospital records of anthrax scaled according to the number of cases, and rectangles indicate when cases in livestock were reported (quality of the data for livestock cases was too poor to quantify). Domestic dogs were sampled in villages near wildlife cases detected in 2006. Error bars indicate mean antibody responses and 95% confidence intervals at the time of sampling; sample sizes are indicated. *During the 1998 outbreak, 549 probable cases and 67 additional suspected cases were detected. OD, optical density.
Main Article
Page created: July 25, 2011
Page updated: July 25, 2011
Page reviewed: July 25, 2011
The conclusions, findings, and opinions expressed by authors contributing to this journal do not necessarily reflect the official position of the U.S. Department of Health and Human Services, the Public Health Service, the Centers for Disease Control and Prevention, or the authors' affiliated institutions. Use of trade names is for identification only and does not imply endorsement by any of the groups named above.