Molecular Epidemiology of Geographically Dispersed Vibrio cholerae, Kenya, January 2009–May 2010
Ahmed Abade Mohamed, Joseph Oundo, Samuel M. Kariuki, Hamadi I. Boga, Shanaz K. Sharif, Willis Akhwale, Jared Omolo, Anyangu S. Amwayi, David Mutonga, David Kareko, Mercy Njeru, Shan Li, Robert F. Breiman, and O. Colin Stine

Author affiliations: Field Epidemiology and Laboratory Training Program, Nairobi, Kenya (A.A. Mohamed, J. Oundo, J. Omolo, A.S. Amwayi); Ministry of Public Health and Sanitation, Nairobi (A.A. Mohamed, S.K. Sharif, W. Akhwale, J. Omolo, A.S. Amwayi, D. Mutonga, M. Njeru); Centers for Disease Control and Prevention, Nairobi (J. Oundo, R.F. Breiman); Kenya Medical Research Institute, Nairobi (J. Oundo, S.M. Kariuki); Jomo Kenyatta University of Agriculture and Technology, Nairobi (H.I. Boga, D. Kareko); University of Maryland School of Medicine, Baltimore, Maryland, USA (S. Li, O.C. Stine)
Main Article
Figure 2
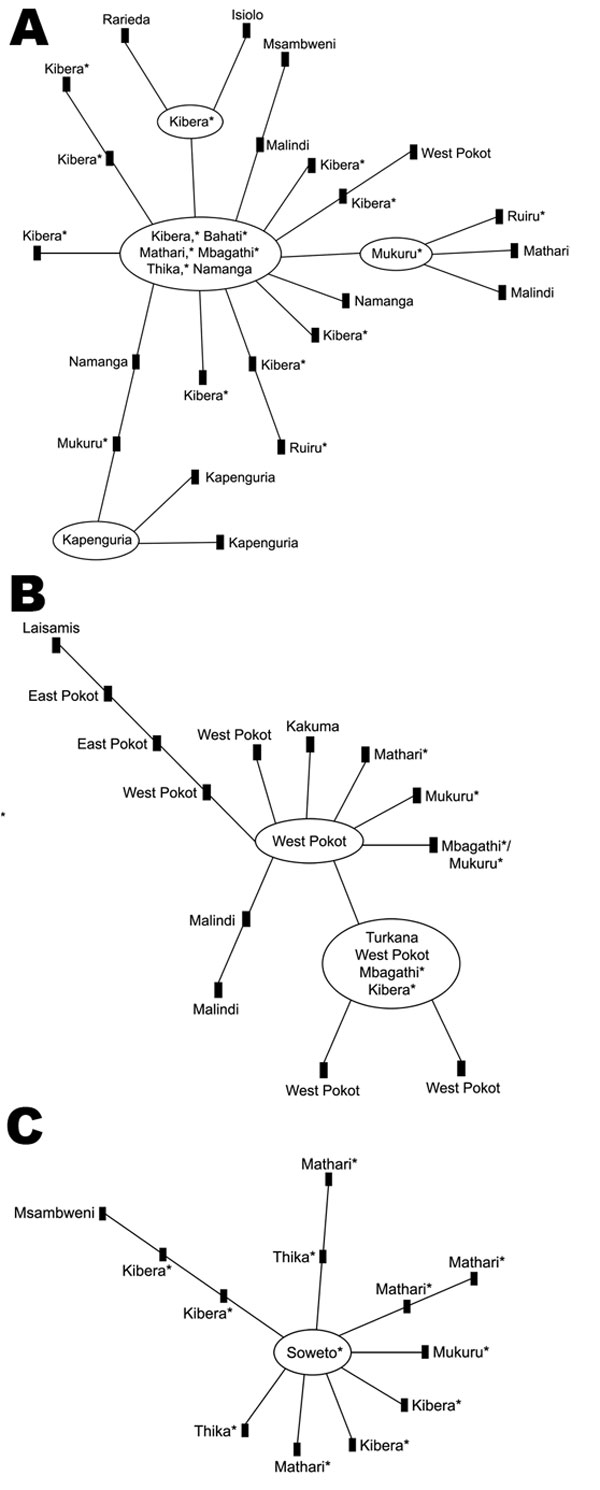
Figure 2. . . Genetic relatedness of O1 Vibrio cholerae isolates from an outbreak of cholera, Kenya, January 2009–May 2010. The 3 largest clonal complexes are shown; smaller clonal complexes consisted of 2 or 3 genotypes. A) Clonal complex 1 was observed in each geographic/climatic region. B) Clonal complex 2 was detected in the Rift Valley (western part of the arid and semi-arid region) and in the coastal, lower eastern, and highland (primarily in informal settlements around Nairobi, represented by asterisks) regions. C) Clonal complex 3 was detected in the coastal, lake, and highland regions and in the Rift Valley (arid and semi-arid region).Genetic relatedness was determined by using eBURSTv3 (http://eburst.mlst.net/). Each genotype is represented by a node in the diagram; each connecting line represents an allelic change at a single locus.
Main Article
Page created: May 10, 2012
Page updated: May 10, 2012
Page reviewed: May 10, 2012
The conclusions, findings, and opinions expressed by authors contributing to this journal do not necessarily reflect the official position of the U.S. Department of Health and Human Services, the Public Health Service, the Centers for Disease Control and Prevention, or the authors' affiliated institutions. Use of trade names is for identification only and does not imply endorsement by any of the groups named above.