Skip directly to site content Skip directly to page options Skip directly to A-Z link Skip directly to A-Z link Skip directly to A-Z link
Volume 18, Number 8—August 2012
Letter

Usefulness of School Absenteeism Data for Predicting Influenza Outbreaks, United States

Joseph R. Egger1, Anne G. Hoen, John S. Brownstein, David L. Buckeridge, Donald R. Olson, and Kevin J. KontyComments to Author 
Author affiliations: New York City Department of Health and Mental Hygiene, New York, New York, USA (J.R. Egger, K.J. Konty); Boston Children’s Hospital, Boston, Massachusetts, USA (A.G. Hoen, J.S. Brownstein); Harvard Medical School, Boston (A.G. Hoen, J.S. Brownstein); McGill University, Montreal, Quebec, Canada (D.L. Buckeridge); and International Society for Disease Surveillance, New York (D.R. Olson)

Main Article

Figure

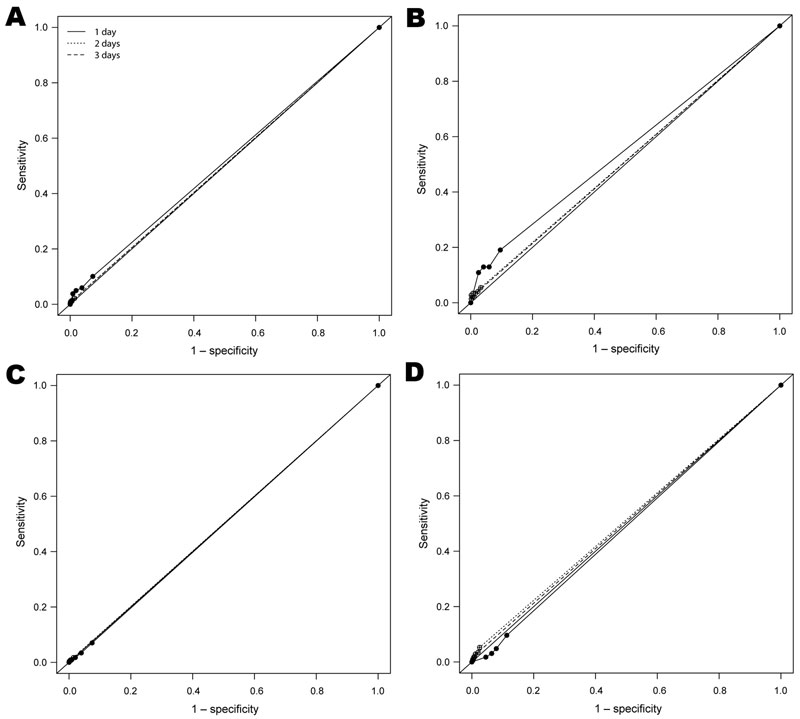
Receiver operating characteristic (ROC) curves showing A) predictive ability of school absenteeism to detect an outbreak (z-score ≥3) of fever/influenza for the entire study period; B) fever/influenza for the pandemic (H1N1) 2009 period; C) absenteeism for the entire study period; and D) absenteeism for the pandemic (H1N1) 2009 period. ROC curves were based on observations of whether 4 absentee threshold z-score levels—1, 1.5, 2, or 2.5—were reached or exceeded for either 1 day, 2 consecutive da

Figure. . Receiver operating characteristic (ROC) curves showing A) predictive ability of school absenteeism to detect an outbreak (z-score ≥3) of fever/influenza for the entire study period; B) fever/influenza for the pandemic (H1N1) 2009 period; C) absenteeism for the entire study period; and D) absenteeism for the pandemic (H1N1) 2009 period. ROC curves were based on observations of whether 4 absentee threshold z-score levels—1, 1.5, 2, or 2.5—were reached or exceeded for either 1 day, 2 consecutive days, or 3 consecutive days as a predictor of the school district outbreak status during the next 7 days. In the ROC curves, sensitivity on the y-axis indicates the true-positive rate, and 1– specificity on the x-axis indicates the false-positive rate. The study was conducted September 6, 2005–June 26, 2009, in New York City, New York, USA.

Main Article

1Current affiliation: SciMetrika, LLC, Research Triangle Park, North Carolina, USA.

Page created: July 20, 2012
Page updated: July 20, 2012
Page reviewed: July 20, 2012
The conclusions, findings, and opinions expressed by authors contributing to this journal do not necessarily reflect the official position of the U.S. Department of Health and Human Services, the Public Health Service, the Centers for Disease Control and Prevention, or the authors' affiliated institutions. Use of trade names is for identification only and does not imply endorsement by any of the groups named above.
file_external