Volume 30, Number 1—January 2024
Dispatch
Tuberculosis Diagnostic Delays and Treatment Outcomes among Patients with COVID-19, California, USA, 2020
Abstract
We assessed tuberculosis (TB) diagnostic delays among patients with TB and COVID-19 in California, USA. Among 58 persons, 43% experienced TB diagnostic delays, and a high proportion (83%) required hospitalization for TB. Even when viral respiratory pathogens circulate widely, timely TB diagnostic workup for at-risk persons remains critical for reducing TB-related illness.
California typically reports one quarter of tuberculosis (TB) cases in the United States and had a 19% case decline during 2020 (1). That decline paralleled national and global observations during the COVID-19 pandemic (1,2). Pandemic-related disruptions challenged healthcare systems and TB control programs by diverting staff and other resources (3,4). Pandemic effects on TB diagnostic and care delays in the United States have not been fully described. We aimed to characterize missed opportunities and diagnostic delays, hospitalizations, and treatment outcomes in a subset of patients in California who had TB and COVID-19 during 2020. The California Department of Public Health, Centers for Disease Control and Prevention, and participating local health departments reviewed and approved this activity. This study was conducted consistent with applicable federal and Centers for Disease Control and Prevention policies (Appendix).
Figure 1
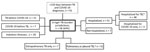
Figure 1. Flowchart of patients included in a study of TB diagnostic delays and treatment outcomes among patients with COVID-19, California, USA, 2020. TB high-burden counties included were Alameda (excluding the city...
Using surveillance records of TB and COVID-19, we used name-based probabilistic matching to find persons with diagnosed TB and COVID-19 in California (5). We abstracted records for 58 patients who had TB disease diagnosed in 2020 and COVID-19 diagnosed within 120 days and who resided in 6 local health jurisdictions with high TB burdens: Los Angeles, San Diego, Santa Clara, Orange, Alameda, and Sacramento Counties (Figure 1). We captured TB and COVID-19 symptom profiles and timing, chest imaging results, TB diagnostic testing, and hospitalizations from TB program, hospital, emergency department, and outpatient records, and from death certificates. We also obtained PCR and antigen-based COVID-19 test results, including negative results, beginning on March 9, 2020. We performed statistical comparisons by using 2-sided χ2 or Fisher exact tests for categorical data and Wilcoxon 2-sample tests for continuous data (α = 0.05) (Appendix).
Among 58 patients with COVID-19 and TB, 51 had pulmonary or pleural TB disease. The median time from symptom onset to TB diagnosis was 29.0 (interquartile range [IQR] 5.0‒95.0) days. Twenty-two (43%) patients had a diagnostic delay of >30 days (median 95.0 [IQR 60.0‒117.0] days) between TB symptom onset and first TB clinical consultation (Table 1; Appendix Table). Patients with diagnostic delays had indicators of more severe TB, such as acid-fast bacilli smear–positive sputum, cavitary imaging results, or disseminated pulmonary disease, than patients without diagnostic delays (86% vs. 55%; p = 0.02). Diagnostic delays were marginally more common among persons with COVID-19 diagnosed during periods of elevated incidence, considered the statewide 7-day average COVID-19 incidence rate of >15 cases/100,000 population, than persons diagnosed at periods without elevated incidence (82% vs. 55%; p = 0.05).
Figure 2
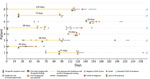
Figure 2. Timeline of 8 patients included in a study of TB diagnostic delays and treatment outcomes among patients with COVID-19, California, USA, 2020. Symptom onset is the date the first symptoms...
Among 51 patients with COVID-19 and pulmonary or pleural TB, 8 (16%) had >1 missed opportunity for TB diagnosis. We defined a missed opportunity as a documented clinical encounter in which a person with TB risk factors (e.g., experiencing homelessness or being non–US-born, in a correctional facility, or HIV-positive) had TB-specific symptoms but no TB diagnostic testing. TB-specific symptoms were hemoptysis, weight loss, or cough >3 weeks, or chest imaging of cavity, tree in bud pattern, pleural effusions, nodules, miliary, or upper lobe infiltrate; TB diagnostic testing included acid-fast bacilli smear or Mycobacterium tuberculosis nucleic acid amplification test. The median time between the first missed opportunity and start of TB diagnostic testing was 62.5 (IQR 33.5‒70.5) days. Five (63%) missed opportunities occurred during periods of elevated COVID-19 incidence, and 4 (50%) patients had COVID-19 testing (2 COVID-19–negative and 2 COVID-19–positive) instead of TB testing at the clinical encounter where the missed opportunity occurred (Figure 2).
Among the 58 patients, 51 (88%) were hospitalized >1 time (Table 2). Among 73 hospitalizations (average 1.3 per person), 35 (48%) were related to TB disease alone, 23 (32%) to indistinct (i.e., concurrent) TB and COVID-19 disease episodes, and 15 (21%) to COVID-19 alone. All 6 in-hospital deaths occurred during COVID-19–associated hospitalizations. The median overall hospital stay was 12 (IQR 7‒21) days and was similar across all 3 disease-associated hospitalizations, even when we excluded in-hospital deaths.
Two patients did not start TB treatment because they died before TB diagnosis. Of the remaining 56 patients, 42 (75%) completed TB treatment within 12 months, 5 (9%) completed treatment in >12 months (including 1 case with rifampin resistance), 1 refused treatment, and 8 (14%) died before completing treatment. Overall, 10 (17%) patients died. Local TB programs determined that 3 (30%) deaths were definitely related to TB, 5 (50%) were possibly related, and 2 (20%) were probably not related. Of the 8 deaths definitely or possibly related to TB, 3 (38%) had TB and COVID-19 listed as contributors on the death certificate, 4 (50%) had only COVID-19, and 1 (16%) had neither term listed.
Delays in TB diagnosis or documentation of a missed opportunity to diagnose TB were more frequent during periods of elevated COVID-19 incidence, potentially because of pandemic-related staff and health system disruptions and community transmission mitigation policies (6,7). Approximately 1 in 6 persons in our sample had a documented clinical encounter where TB diagnostic evaluations could have been initiated earlier, which was consistent with literature published before the pandemic (8). Delayed diagnosis could lead to increased TB transmission and worse TB outcomes; in this analysis, delayed diagnosis appeared to be associated with more advanced TB, suggesting more infectiousness.
In our sample, 83% of patients had >1 TB-related hospitalization, which is higher than the prepandemic frequency of TB-associated hospitalization in California, which previously was reported as ≈50% (9). This finding might have been influenced by the slightly older age distribution of this patient cohort (median 57.5 [IQR 42‒76] years) compared with pre-pandemic TB patients (median 56.0 IQR 35‒70 [years]) in California from 2017‒2019 (5). The median duration of TB-related hospital stays did not change compared with historical TB hospitalizations in California (9).
TB treatment completion appeared consistent with the pre–COVID-19 era in which ≈75% of patients completed TB treatment within 12 months (10). As we previously described, the proportion of deaths among TB patients with COVID-19 was higher than for TB patients in the recent pre-pandemic period (5). Most (77%) deaths were definitely or possibly TB-related but TB attribution on death certificates had poor correlation with detailed retrospective review, as has also been historically described (11). Thus, death certificates are unlikely to yield accurate estimates for deaths related to TB and COVID-19 co-infections.
Limitations of this study include use of observational data and lack of a comparison cohort of persons with TB who did not have COVID-19 in 2020 but had the same detailed clinical data. Our small sample size also precluded robust subgroup comparisons. The 6 participating TB programs represented 55% of California’s population (12), 53% of reported COVID-19 (13), and 66% of the state’s reported TB in 2020 (1). Nonetheless, our findings may not be generalizable to all areas of California or to other US regions.
In summary, delays in TB diagnoses continued to occur and the frequency of TB-related hospitalizations was higher for patients diagnosed with both TB and COVID-19 during the pandemic than historically observed in California. Nonetheless, the proportion of TB patients with COVID-19 completing treatment within 12 months was similar to persons with TB in the prepandemic period, suggesting TB programs managed to maintain TB treatment standards despite redirection of staff and resources. Pursuing a diagnostic workup for persons at risk of developing TB disease, even when a viral respiratory pathogen is widely circulating, remains critical for reducing TB-related illness in California.
Ms. Han is an epidemiologist with California Department of Public Health (CDPH), Richmond, California, USA. Her research interests are related to TB surveillance and epidemiology. Dr. Nabity is a Centers for Disease Control and Prevention medical officer and epidemiologist affiliated with CDPH. His research interests focus on the epidemiology of infectious diseases, including TB and COVID-19.
Author contributions: All authors contributed to study design, data collection, scientific interpretation, and review and approval of the final manuscript. S.D., R.G., M.M., A.K., S.B., A.C., M.C., A.K., Q.N., J.L., and J.H. implemented the study protocol and abstracted data. M.C. provided estimates of recent transmission. E.H. and H.H. curated and analyzed the data. E.H., S.A.N., and S.D. drafted the original manuscript. S.A.N., S.J., P.B., and J.F. coordinated the project.
Acknowledgment
We thank Vilma A. Contreras, Rebecca Fisher, and Jane Lam for assisting in data collection and management; Tambi Shaw for assistance estimating recent transmission; and Melissa Ehman and Joan Sprinson developing tools to assess diagnostic delays and TB-related deaths.
References
- Deutsch-Feldman M, Pratt RH, Price SF, Tsang CA, Self JL. Tuberculosis - United States, 2020. MMWR Morb Mortal Wkly Rep. 2021;70:409–14. DOIPubMedGoogle Scholar
- World Health Organization. Global tuberculosis report 2021 [cited 2022 Apr 27]. https://www.who.int/publications/i/item/9789240037021
- Blecker S, Jones SA, Petrilli CM, Admon AJ, Weerahandi H, Francois F, et al. Hospitalizations for chronic disease and acute conditions in the time of COVID-19. JAMA Intern Med. 2021;181:269–71. DOIPubMedGoogle Scholar
- Nabity SA, Fong V, Keh C, Flood J. Disruptions to TB program services and capacity during the COVID-19 response in California, January 2020–August 2021. In: Abstracts of the National TB Controllers Association/California TB Controllers Association Conference, 2022. Palm Springs, CA, USA; 2022 May 23–26. Smyrna (GA): National TB Controllers Association; 2022.
- Nabity SA, Han E, Lowenthal P, Henry H, Okoye N, Chakrabarty M, et al. Sociodemographic characteristics, comorbidities, and mortality among persons diagnosed with tuberculosis and COVID-19 in close succession in California, 2020. JAMA Netw Open. 2021;4:
e2136853 . DOIPubMedGoogle Scholar - Readhead A, Cooksey G, Flood J, Barry P. Hospitalizations with TB, California, 2009-2017. Int J Tuberc Lung Dis. 2021;25:640–7. DOIPubMedGoogle Scholar
- State of California. Tracking COVID-19 in California [cited 2022 Jun 15]. https://covid19.ca.gov/state-dashboard
- Miller AC, Polgreen LA, Cavanaugh JE, Hornick DB, Polgreen PM. Missed opportunities to diagnose tuberculosis are common among hospitalized patients and patients seen in emergency departments. Open Forum Infect Dis. 2015;2:
ofv171 . DOIPubMedGoogle Scholar - The Commonwealth Fund. 2022 Scorecard on state health system performance [cited 2023 Oct 5]. https://www.commonwealthfund.org/publications/scorecard/2022/jun/2022-scorecard-state-health-system-performance
- Ledesma JR, Zou L, Chrysanthopoulou SA, Giovenco D, Khanna AS, Lurie MN. Community mitigation strategies, mobility, and COVID-19 incidence across three waves in the United States in 2020. Epidemiology. 2023;34:131–9. DOIPubMedGoogle Scholar
- California Department of Public Health. Report on tuberculosis in California, 2019. Sacramento: The Department; 2020.
- Beavers SF, Pascopella L, Davidow AL, Mangan JM, Hirsch-Moverman YR, Golub JE, et al.; Tuberculosis Epidemiologic Studies Consortium. Tuberculosis mortality in the United States: epidemiology and prevention opportunities. Ann Am Thorac Soc. 2018;15:683–92. DOIPubMedGoogle Scholar
- State of California Department of Finance. Report P-2C: population projections by sex and 5-year age group, 2010–2060: California counties (2019 baseline) [cited 2022 Apr 27]. https://covid19.ca.gov/state-dashboard
Figures
Tables
Cite This ArticleOriginal Publication Date: December 16, 2023
1These first authors contributed equally to this article.
Table of Contents – Volume 30, Number 1—January 2024
| EID Search Options |
|---|
|
|
|
|
|
|
Please use the form below to submit correspondence to the authors or contact them at the following address:
Scott A. Nabity, California Department of Public Health, 850 Marina Bay Pwky, Bldg P Fl 2, Richmond, CA 94804, USA
Top