Volume 6, Number 3—June 2000
Perspective
Remote Sensing and Human Health: New Sensors and New Opportunities
Figure 1
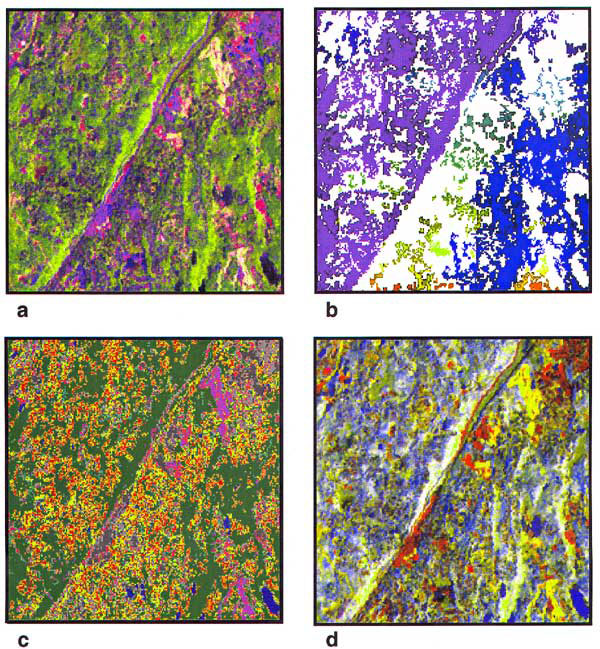
Figure 1. Landsat Thematic Mapper (TM) satellite data for a 6x6-km area in Westchester County, New York. Shown are the raw data (a), as well as products (e.g., maps) derived from the data (b-d) that might be used for modeling Lyme disease transmission risk. a) Raw Landsat TM image composed of bands 5, 4, and 3 (mid-infrared, near-infrared, and red bands). Vegetation is shown in shades of green, with bare soil and urban areas shown in shades of pink and purple. The spatial resolution of these data is 30x30 m. b) Map showing contiguous forest patches, derived from a Landsat TM classification. Colors represent discrete patches, with white indicating the absence of contiguous forest. c) A 12-class land cover map derived from the Landsat TM data. d) Composite image of three spectral indices derived from the Landsat TM data, showing the contributions of scene brightness in red, greenness in green, and wetness in blue.
1CHAART was established at Ames Research Center by NASA's Life Sciences Division, within the Office of Life & Microgravity Sciences & Applications, to make remote sensing, geographic information systems, global positioning systems, and computer modeling available to investigators in the human health community.
2The information gathered during the CHAART sensor evaluation process is available at http://geo.arc.nasa.gov/sge/health/sensor/sensor.html.