Volume 12, Number 1—January 2006
Research
SARS–associated Coronavirus Replication in Cell Lines
Figure 2

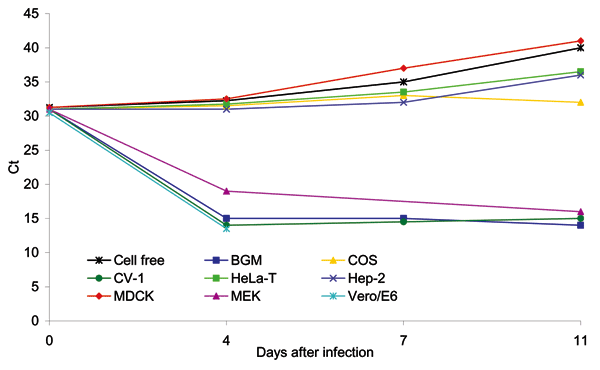
Figure 2. Cycle threshold (Ct) changes measured by real-time polymerase chain reaction versus days after infection of the indicated cell lines. The cell-free sample had an initial Ct of 31, which rose to 40 by day 11. Reductions in the Ct or flat-line Ct values (e.g., COS cells) indicate replication of the virus. Continued increases in Ct above the initial value of 31 by days 7 and 11 indicate failure to replicate.
Page created: February 16, 2012
Page updated: February 16, 2012
Page reviewed: February 16, 2012
The conclusions, findings, and opinions expressed by authors contributing to this journal do not necessarily reflect the official position of the U.S. Department of Health and Human Services, the Public Health Service, the Centers for Disease Control and Prevention, or the authors' affiliated institutions. Use of trade names is for identification only and does not imply endorsement by any of the groups named above.