Volume 13, Number 1—January 2007
Research
Prevalence of G2P[4] and G12P[6] Rotavirus, Bangladesh
Mustafizur Rahman*† , Rasheda Sultana*, Giasuddin Ahmed*, Sharifun Nahar*, Zahid M. Hassan*, Farjana Saiada*, Goutam Podder*, Abu S. G. Faruque*, A. K. Siddique*, David A. Sack*, Jelle Matthijnssens†, Marc Van Ranst†, and Tasnim Azim*
Figure 2
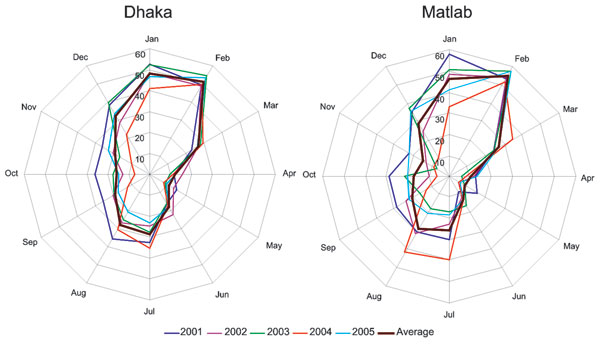
Figure 2. Distribution of rotavirus-positive patients by month, Dhaka and Matlab, Bangladesh. Percentages of positive rotavirus patients were calculated based on all diarrhea patients admitted to the Dhaka and Matlab hospital surveillance system during 2001–2005. The years are shown with different colored lines. The thick brown line represents the average for all years.
Page created: June 28, 2010
Page updated: June 28, 2010
Page reviewed: June 28, 2010
The conclusions, findings, and opinions expressed by authors contributing to this journal do not necessarily reflect the official position of the U.S. Department of Health and Human Services, the Public Health Service, the Centers for Disease Control and Prevention, or the authors' affiliated institutions. Use of trade names is for identification only and does not imply endorsement by any of the groups named above.