Volume 17, Number 8—August 2011
Research
Novel Surveillance Network for Norovirus Gastroenteritis Outbreaks, United States1
Everardo Vega, Leslie Barclay, Nicole Gregoricus, Kara Williams, David Lee, and Jan Vinjé
Figure 2
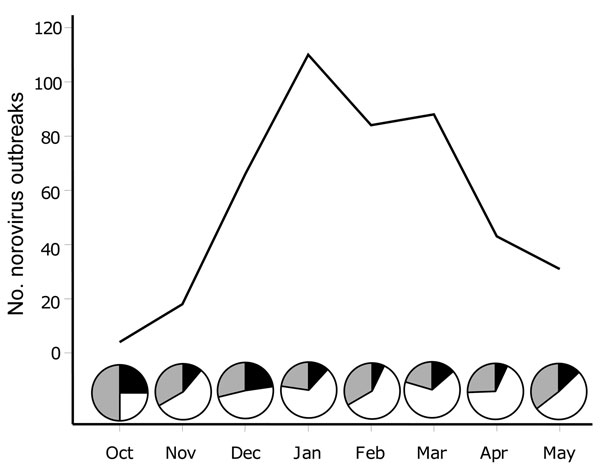
Figure 2. Gastroenteritis outbreak data submitted to CaliciNet from October 2009 through May 2010. Pie graphs represent the proportion of outbreaks reported as norovirus GII.4 New Orleans (white), norovirus GII.4 Minerva (black), and all other norovirus genotypes (gray).
1Additional members of the CaliciNet participating laboratories who contributed data are listed at the end of this article.
Page created: August 15, 2011
Page updated: August 15, 2011
Page reviewed: August 15, 2011
The conclusions, findings, and opinions expressed by authors contributing to this journal do not necessarily reflect the official position of the U.S. Department of Health and Human Services, the Public Health Service, the Centers for Disease Control and Prevention, or the authors' affiliated institutions. Use of trade names is for identification only and does not imply endorsement by any of the groups named above.