Volume 20, Number 11—November 2014
Research
Death Patterns during the 1918 Influenza Pandemic in Chile
Gerardo Chowell , Lone Simonsen, Jose Flores, Mark A. Miller, and Cécile Viboud
Figure 2
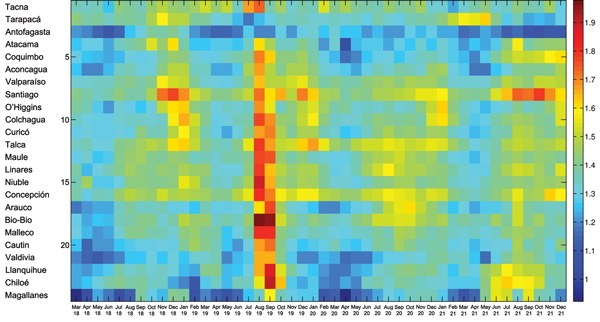
Figure 2. Temporal evolution (March 1918–December 1921) of all-cause mortality rates during the 1918 influenza pandemic across 24 provinces of Chile, sorted in geographic order from northern to southern Chile. For visualization purposes, the time series are log transformed.
Page created: October 17, 2014
Page updated: October 17, 2014
Page reviewed: October 17, 2014
The conclusions, findings, and opinions expressed by authors contributing to this journal do not necessarily reflect the official position of the U.S. Department of Health and Human Services, the Public Health Service, the Centers for Disease Control and Prevention, or the authors' affiliated institutions. Use of trade names is for identification only and does not imply endorsement by any of the groups named above.