Skip directly to site content Skip directly to page options Skip directly to A-Z link Skip directly to A-Z link Skip directly to A-Z link
Volume 21, Number 12—December 2015
Letter

Emerging Rabbit Hemorrhagic Disease Virus 2 (RHDVb), Australia

Robyn N. Hall1, Jackie E. Mahar1, Stephanie Haboury, Vicky Stevens, Edward C. Holmes, and Tanja StriveComments to Author 
Author affiliations: CSIRO Health and Biosecurity, Canberra, Australian Capital Territory, Australia (R.N. Hall, J.E. Mahar, S. Haboury, T. Strive); Invasive Animals CRC, Bruce, Australian Capital Territory, Australia (R.N. Hall, S. Haboury, T. Strive); The University of Sydney, School of Biological Sciences, Sydney, New South Wales, Australia (J.E. Mahar, E.C. Holmes); CSIRO Australian Animal Health Laboratories, Geelong, Victoria, Australia (V. Stevens)

Main Article

Figure

Maximum-likelihood phylogenetic analysis of the nonstructural protein genes (A) and the capsid gene (B) of rabbit hemorrhagic disease virus (RHDV) sequences. The 3 recent Australian field isolates  sequenced for this study (indicated in bold) were aligned with representative RHDV and Australian rabbit calicivirus (RCV-A1) sequences from GenBank (accession numbers indicated in taxa names). Phylogenetic analysis was conducted separately for both the nonstructural genes (panel A) and the capsid gen

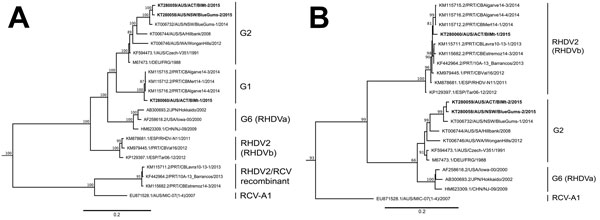
Figure. Maximum-likelihood phylogenetic analysis of the nonstructural protein genes (A) and the capsid gene (B) of rabbit hemorrhagic disease virus (RHDV) sequences. The 3 recent Australian field isolates sequenced for this study (indicated in bold) were aligned with representative RHDV and Australian rabbit calicivirus (RCV-A1) sequences from GenBank (accession numbers indicated in taxa names). Phylogenetic analysis was conducted separately for both the nonstructural genes (panel A) and the capsid gene (panel B). Phylogenies were rooted by using an early European brown hare syndrome virus strain (not shown). Statistical support for individual nodes was estimated from 1,000 bootstrap replicates with values shown for only those nodes where the bootstrap support was ≥70% (and all major nodes). Phylogenies were constructed by using the general time reversible plus gamma model of nucleotide substitution, as determined in jModelTest, by using PhyML(as available in Geneious version 8.1.5; Biomatters Limited, Auckland, New Zealand). Scale bars are proportional to the number of nucleotide substitutions per site.

Main Article

1These first authors contributed equally to this article.

Page created: November 17, 2015
Page updated: November 17, 2015
Page reviewed: November 17, 2015
The conclusions, findings, and opinions expressed by authors contributing to this journal do not necessarily reflect the official position of the U.S. Department of Health and Human Services, the Public Health Service, the Centers for Disease Control and Prevention, or the authors' affiliated institutions. Use of trade names is for identification only and does not imply endorsement by any of the groups named above.
file_external