Volume 21, Number 9—September 2015
Dispatch
Reemergence and Autochthonous Transmission of Dengue Virus, Eastern China, 2014
Wen Wang1, Bin Yu1, Xian-Dan Lin1, De-Guang Kong, Jian Wang, Jun-Hua Tian, Ming-Hui Li, Edward C. Holmes, and Yong-Zhen Zhang
Figure 2
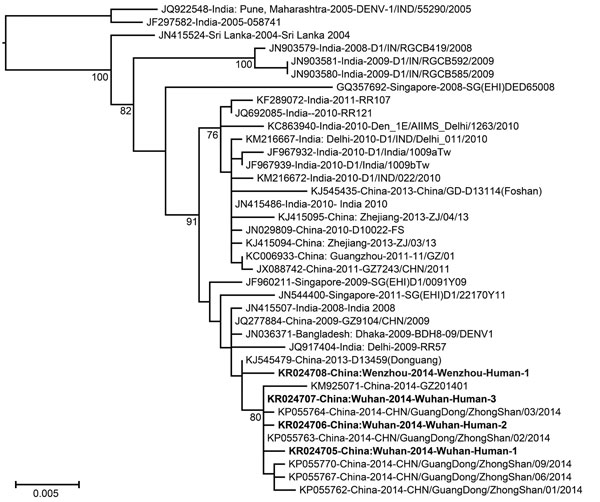
Figure 2. Phylogenetic analysis of a subset of dengue virus 1 E gene sequences within genotype III that are most closely related to those sampled from Wenzhou, Zhejiang Province, and Wuhan, Hubei Province, China, during 2014. The viruses identified in this study were designated as the Wenzhou-human and Wuhan-human sequences, respectively (GenBank accession nos. KR024705–KR024708). Bootstrap values (>70%) are shown at relevant nodes. Bold text indicates sequences obtained in this study. The tree is midpoint rooted for clarity. Scale bar indicates nucleotide substitutions per site.
1These authors contributed equally to this article.
Page created: August 14, 2015
Page updated: August 14, 2015
Page reviewed: August 14, 2015
The conclusions, findings, and opinions expressed by authors contributing to this journal do not necessarily reflect the official position of the U.S. Department of Health and Human Services, the Public Health Service, the Centers for Disease Control and Prevention, or the authors' affiliated institutions. Use of trade names is for identification only and does not imply endorsement by any of the groups named above.