Skip directly to site content Skip directly to page options Skip directly to A-Z link Skip directly to A-Z link Skip directly to A-Z link
Volume 22, Number 4—April 2016
Letter

Enterovirus A71 Genogroups C and E in Children with Acute Flaccid Paralysis, West Africa

Maria D. Fernandez-GarciaComments to Author , Ousmane Kebe, Aichatou D. Fall, Hamet Dia, Ousmane M. Diop, Francis Delpeyroux, and Kader Ndiaye
Author affiliations: Institut Pasteur, Dakar, Senegal (M.D. Fernandez-Garcia, O. Kebe, A.D. Fall, H. Dia, K. Ndiaye); World Health Organization, Geneva, Switzerland (O.M. Diop); Institut Pasteur, Paris, France (F. Delpeyroux); Institut National de Santé et de La Recherche Médicale, Paris (F. Delpeyroux)

Main Article

Figure

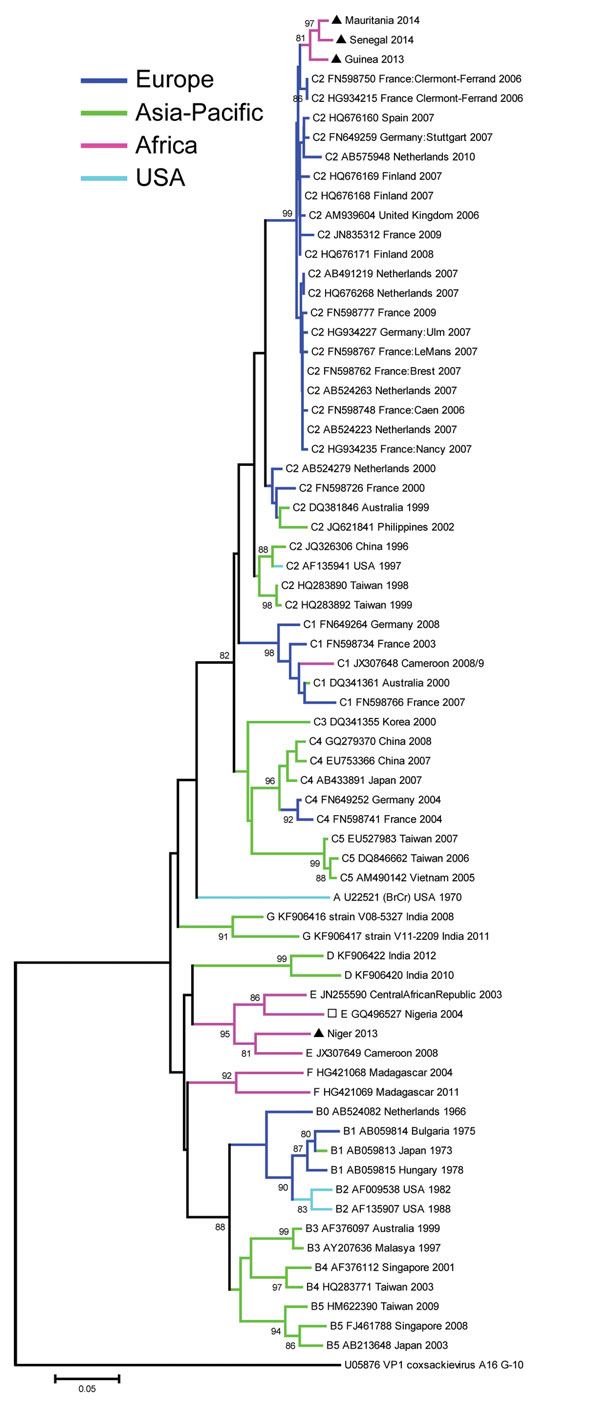
Phylogenetic tree created with the complete VP1 nucleotide sequences (891 bp in length) of enterovirus A71 isolated from 4 patients with acute flaccid paralysis in West Africa, the most similar nucleotide sequences identified by a search in GenBank by using BLAST (http://www.ncbi.nlm.nih.gov/), and a representative global set of enterovirus A71 sequences belonging to different genogroups and subgenogroups. The coxsackievirus A16 prototype G-10 sequence was introduced as the outgroup. The tree wa

Figure. Phylogenetic tree created with the complete VP1 nucleotide sequences (891 bp in length) of enterovirus A71 isolated from 4 patients with acute flaccid paralysis in West Africa, the most similar nucleotide sequences identified by a search in GenBank by using BLAST (http://www.ncbi.nlm.nih.gov/), and a representative global set of enterovirus A71 sequences belonging to different genogroups and subgenogroups. The coxsackievirus A16 prototype G-10 sequence was introduced as the outgroup. The tree was inferred with a neighbor-joining method that used MEGA5 software (http://www.megasoftware.net/). Distances were computed by using the Kimura 2–parameter model. The robustness of the nodes was tested by using 1,000 bootstrap replications. Bootstrap support values >80 are shown in nodes. The 4 black triangles indicate the 4 strains from this study. The open square represents a partial sequence. Scale bar represents nucleotide substitutions per site. Abbreviations of virus names indicate genogroups or subgenogroups/GenBank accession number/origin/year of isolation, respectively.

Main Article

Page created: March 16, 2016
Page updated: March 16, 2016
Page reviewed: March 16, 2016
The conclusions, findings, and opinions expressed by authors contributing to this journal do not necessarily reflect the official position of the U.S. Department of Health and Human Services, the Public Health Service, the Centers for Disease Control and Prevention, or the authors' affiliated institutions. Use of trade names is for identification only and does not imply endorsement by any of the groups named above.
file_external